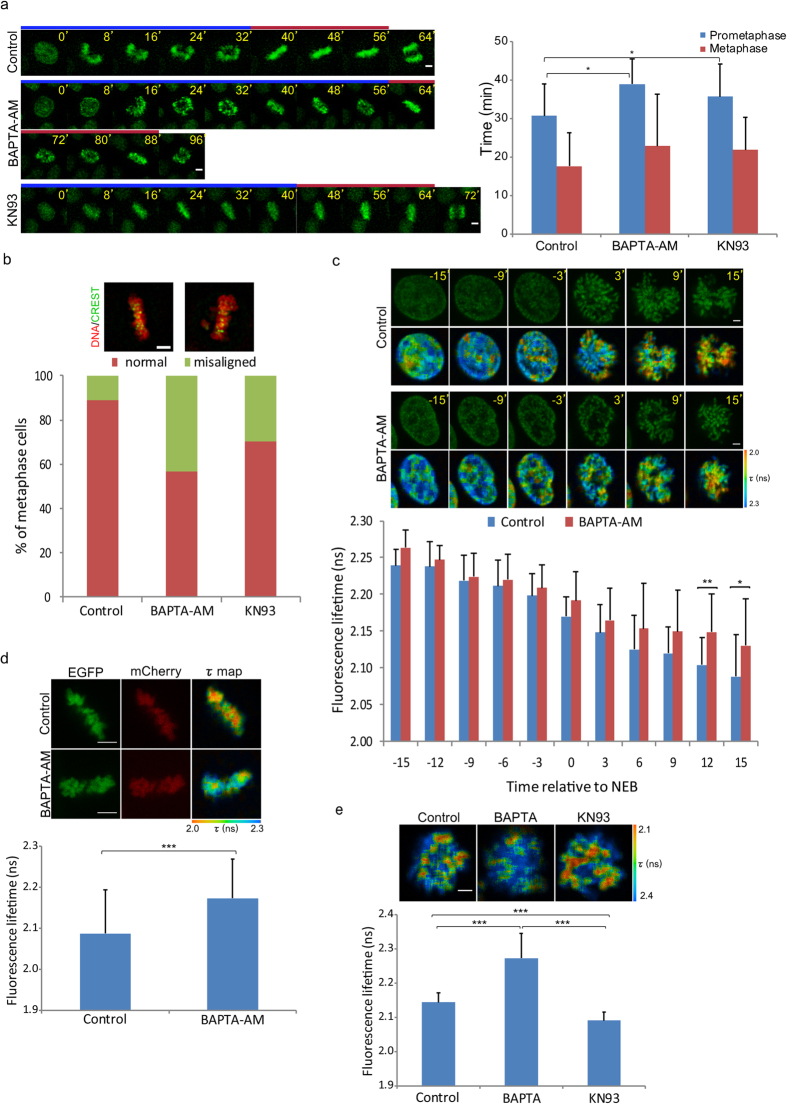
Figure 1. Effect of Ca2+ depletion on mitotic progression.
(a) Mitotic progression in control (n = 15 cells), BAPTA-AM-treated (n = 23 cells) and KN93-treated (n = 32 cells) cells monitoring from nuclear envelop breakdown (NEB, set at t = 0 min) to the onset of anaphase. BAPTA-AM is a membrane permeable Ca2+-chelating agent while KN93 is an inhibitor of CaMKII. The H2B-EGFP signal was detected to visualize chromatin. (b) Defects in chromosome alignment in control and Ca2+-depleted cells (n > 150 cells). (c) Chromosome compaction during mitosis was quantified by FLIM-FRET analysis using 2P-FLIM with 880 nm excitation. Chromosome condensation was observed from prophase to prometaphase. NEB was set at t = 0 min. Pseudocolours represent fluorescence lifetime (τ) of EGFP. Stacked columns showed mean fluorescence lifetime from 13 cells for control and Ca2+-depletion. (d) Compaction of chromosomes in control (n = 27 cells) and Ca2+-depleted (n = 27 cells) metaphase cells. (e) Compaction of chromosomes in nocodazole-arrested cells treated with DMSO (n = 24 cells), BAPTA (with ionomycin, n = 19 cells) or KN93 (n = 31 cells). Error bars indicate standard deviations. Bar, 5 μm.

