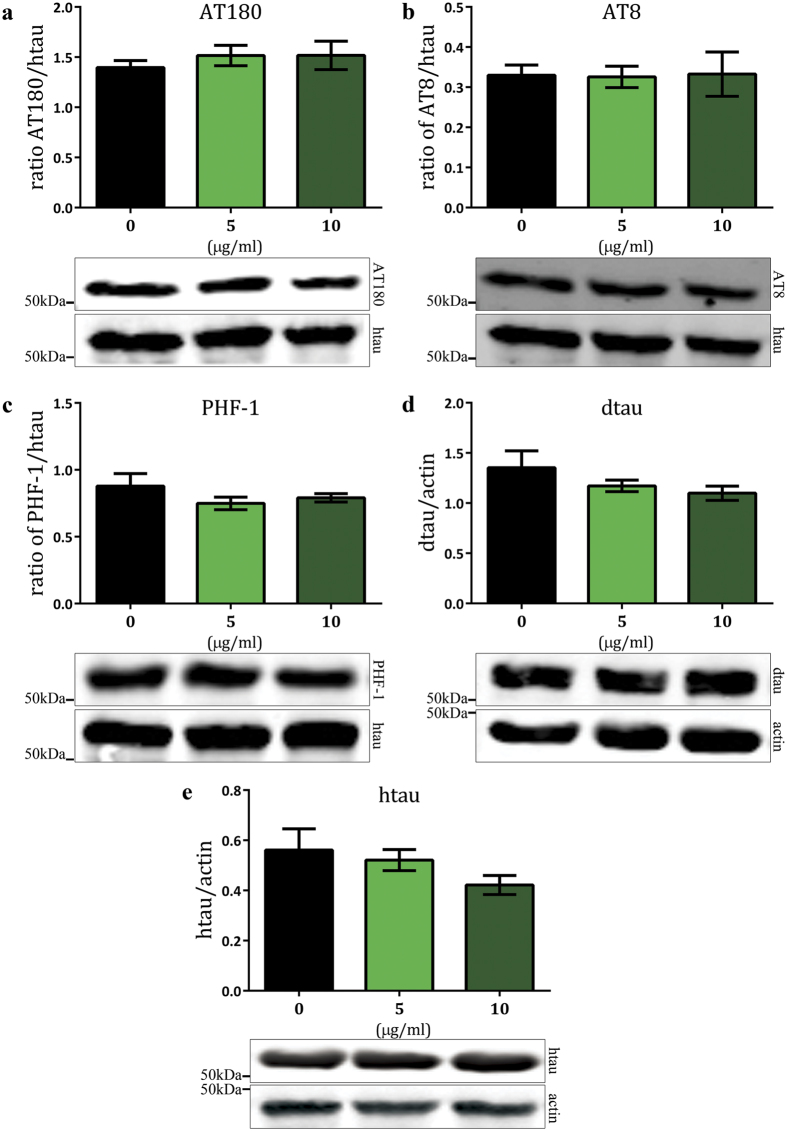
Figure 3. SAL does not alter total htau0N3R levels or phosphorylation at a number of sites relevant to AD.
For each phospho-tau antigen, intensity of signal (pixels/mm2) was normalised to total tau levels. There was no significant change in the levels of the phospho-tau epitopes detected by AT180 (a), AT8 (b), and PHF-1 (c) after treatment with 5 μg/ml SAL (green bars) and 10 μg/ml SAL (dark green bars) SAL. Total dtau levels were not altered by SAL treatment (d). Representative blots are shown (a-d). All lanes were run on the same gel. Data were analysed by one-way ANOVA with Bonferroni’s correction. Error bars represent mean ± S.E.M; n = htau0N3R (5), 5 μg/ml SAL (5), 10 μg/ml SAL (5).

