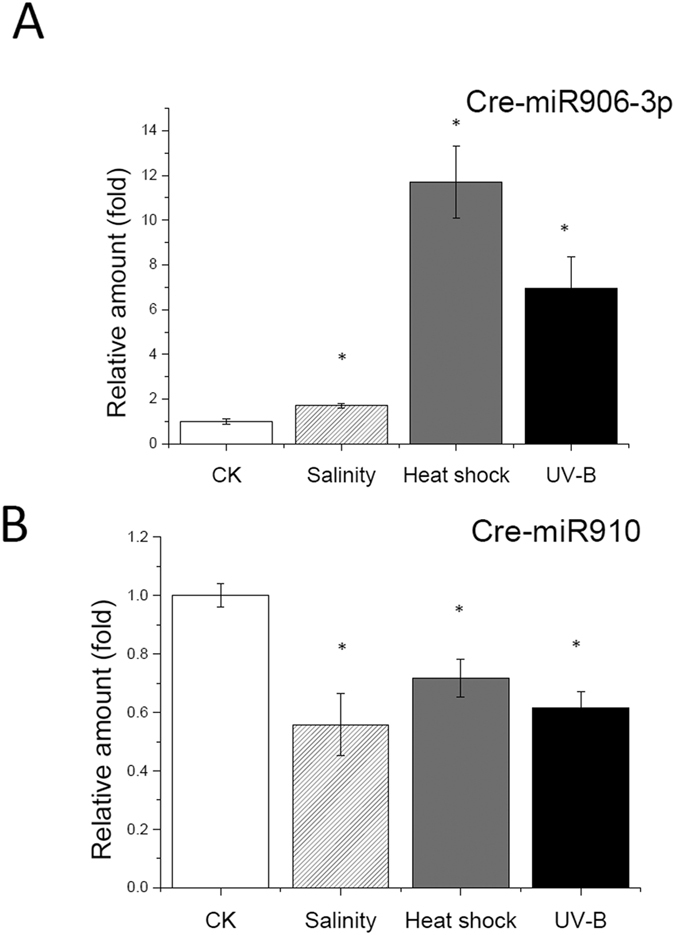
Figure 1.

Expression pattern of Cre-miR906-3p (A) and Cre-miR10 (B) under multiple stresses (heat shock, salinity, and UV-B). *Indicates that differences between the stress treated cells (Heat shock, Salinity and UV-B) and the control cells (CK, no treatment) were considered to be significant at P < 0.05.
