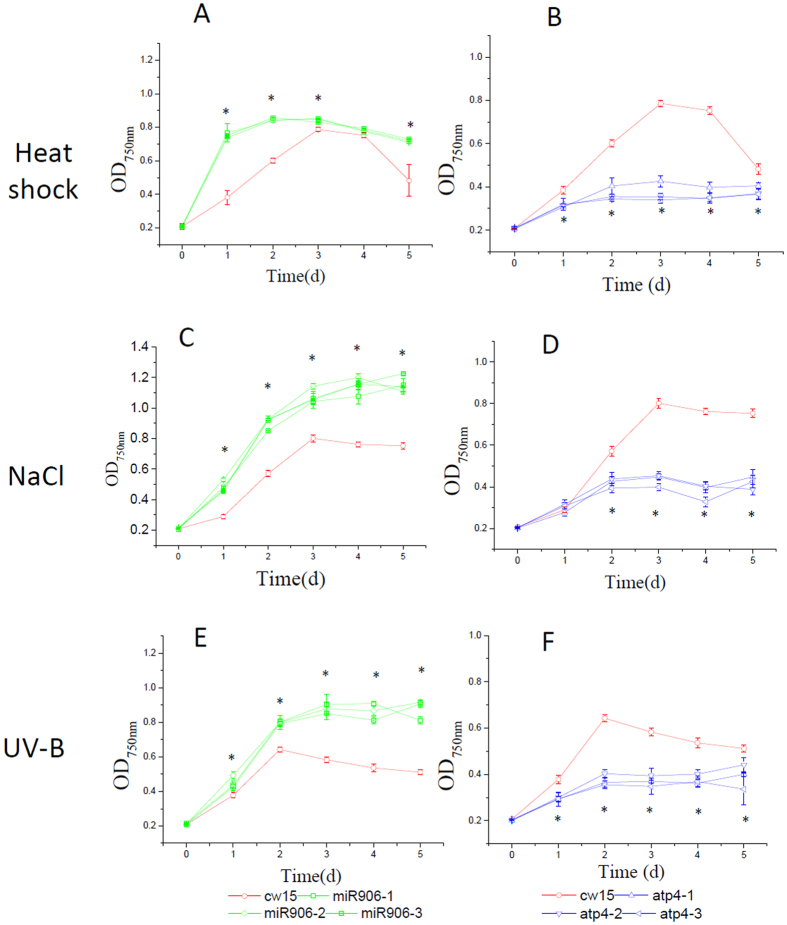
Figure 3. Growth of the cell lines overexpressing Cre-miR906-3p (3 strains represented by green lines and quadrilateral symbols: miR906-1, miR906-2, and miR906-3), ATP4 (3 strains represented by blue lines and triangle symbols: atp4-1, atp4-2, and atp4-3), and wild-type (cw15, red line with a circle symbol) subjected to multiple stresses.
(A,B) Heat shock; (C,D) Salinity; (E,F) UV-B. Technical and biological repeats are 3; *indicates that differences between the overexpression lines (all 3 biological repeats) and the wild-type lines (cw15) were considered to be significant at P < 0.05.

