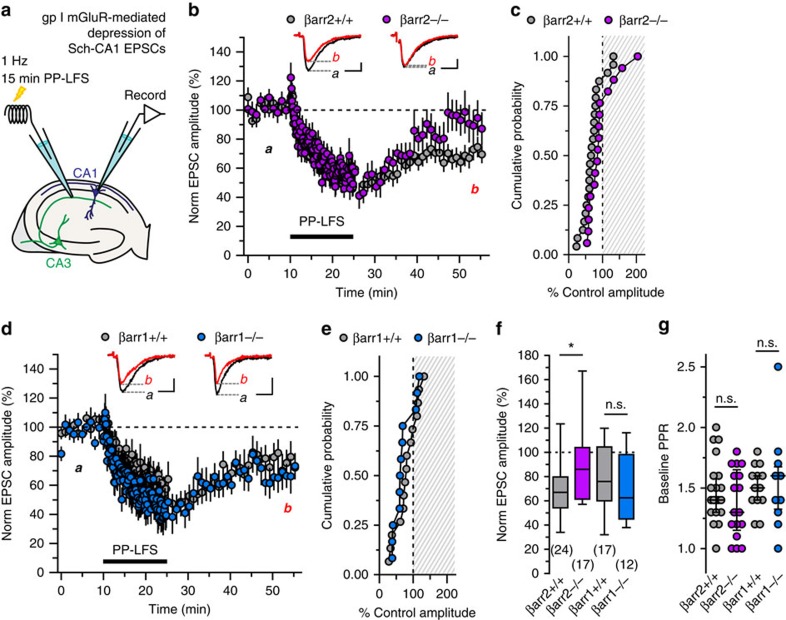
Figure 5. Deficits in CA1 mGluR-LTD in β-arrestin2−/− neurons.
(a) Whole-cell voltage-clamp recordings in acute hippocampal CA1 slice recordings. Schaffer collaterals in the stratum radiatum received PP-LFS for 15 min, which depresses EPSC amplitudes recorded in CA1 pyramidal neurons. (b,c) Group I mGluR-mediated depression of Sch-CA1 synaptic transmission is impaired in βarr2−/− mice. A time course plot shows persistent depression of EPSC amplitudes 30 min after PP-LFS in βarr2+/+ mice (n=24 cells from 17 animals). In contrast, Sch-CA1 EPSCs from βarr2−/− animals recover more than wild types 25–30 min after PP-LFS (P=0.03, n=17 cells from 10 animals). For illustrative purposes, every third event was plotted during basal stimulation, and every ninth event was plotted during 1 Hz PP-LFS. A cumulative probability histogram illustrates separation of post-PP-LFS amplitudes between βarr2+/+ and βarr2−/− recordings. (d,e) PP-LFS induces equivalent depression of Sch-CA1 EPSCs in βarr1−/− and βarr1+/+ (P=0.39, n=12 cells from seven wild-type animals, n=17 cells from 10 βarr1−/− mice), shown in time course and cumulative probability histograms. (f) Summary box plot of PP-LFS LTD post-train amplitudes from βarr2 and βarr1 groups. (g) Baseline PPRs measured using βarr2- and βarr1-null mice were not different from wild-type littermates (P=0.46 for βarr2+/+ and βarr2−/−, P=0.56 for βarr1+/+ and βarr1−/−). Median and interquartile ranges are provided. Calibration of representative traces: x axes, 10 ms; y axes, 100 pA. Groups were compared by Mann–Whitney tests. Asterisks denote significance (*P<0.05); n.s., non-significant.

