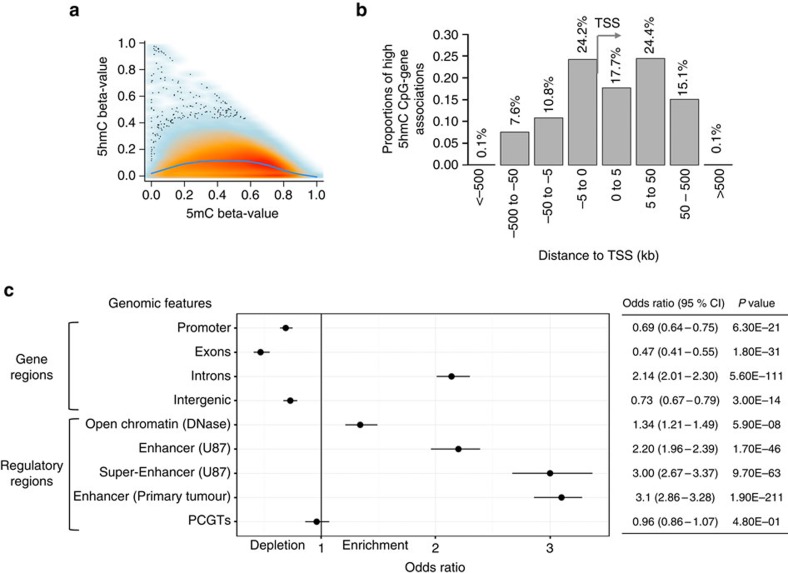
Figure 3. 5hmC in glioblastoma is enriched at gene regulatory regions.
(a) 5hmC-5mC scatterplot for the highest 5hmC CpGs (n=3,876) with smooth curve fitted by loess across thirty glioblastomas. Each point represents a single CpG per tumour with the highest intensity values represented in red and lower intensity (that is, fewer signals) represented in blue. (b) The distribution of high 5hmC CpGs relative to the nearest canonical transcriptional start site (TSS) in kilo base pairs with category bins for genomic distance shown for both upstream and downstream of the TSS. Percentage of high 5hmC CpGs (n=3,876) are shown above each proportion. (c) Forest plot of odds ratios and 95% confidence intervals (Cochran-Mantel-Haenszel or Fisher's exact test) for enrichment of high 5hmC genomic regions against 450K background set. Numerical representation of the odds ratio and associated P-value for each genomic feature are also presented.

