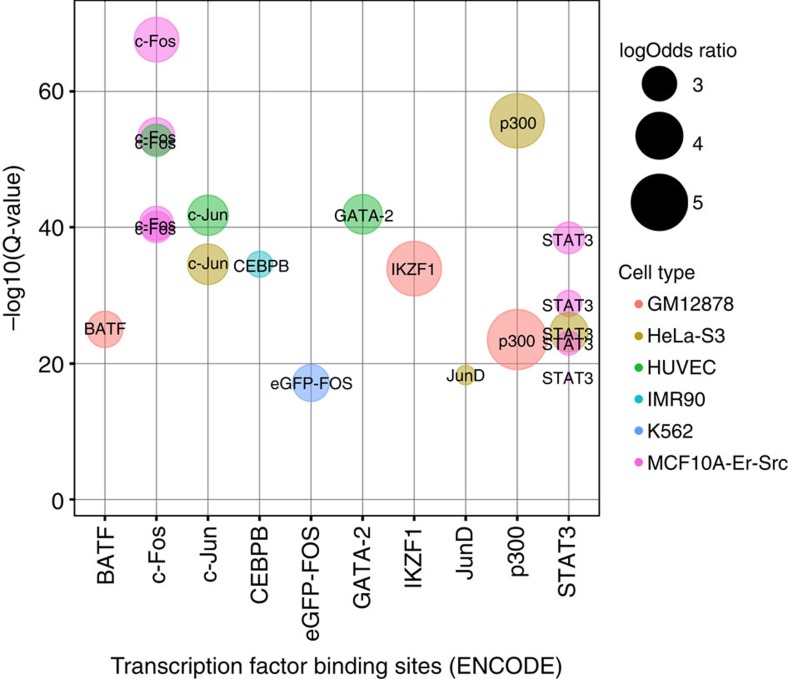
Figure 4. Biological interpretation of genomic regions with high 5hmC.
Significance of overlap between high 5hmC regions in glioblastoma with binding sites of transcription factors profiled by ENCODE. The top 10 enriched transcription factors (TFs) as obtained by LOLA analysis are shown. TF are plotted on the x-axis sorted by TF Q-values (Fisher's exact test, corrected for multiple hypotheses testing of 689 TFs) on the y-axis. The log odds ratio for each TF is represented by bubble size and the cell line in which the ChIP-seq experiment was conducted is indicated by bubble colour.

