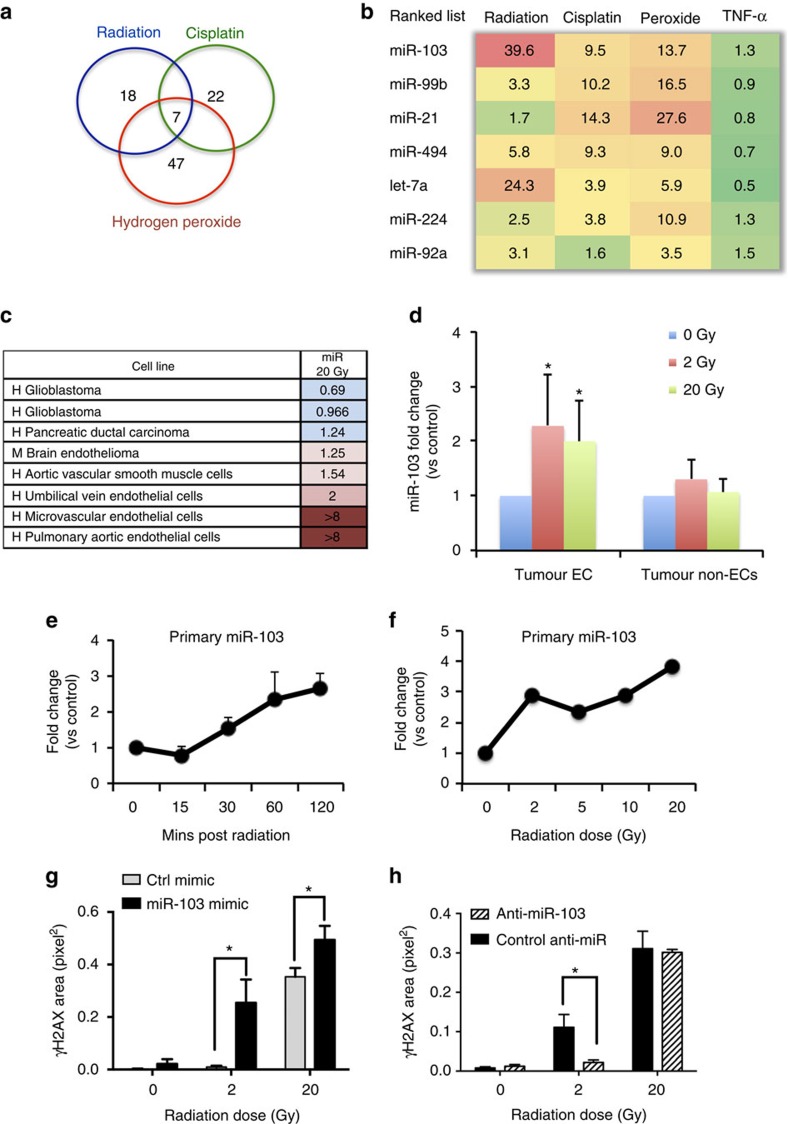
Figure 1. miR-103 is upregulated during DNA damage and exacerbates DNA ds breaks.
(a) Venn diagrams showing miR profiling results from HUVECs treated with the indicated genotoxic agents and (b) expression levels of the top seven upregulated miRs (at least 1.5-fold cutoff). The numbers indicate fold change over control treated HUVECs normalized to a housekeeping small RNA at 6 h post treatment. (c) Heatmap depicting expression of miR-103 in different vascular cell types 6 h after radiation. Numbers depict mean fold increases over mock-treated cells. (d) qRT-PCR showing the expression of miR-103 in ECs 3 h post radiation in a 4T1 mammary carcinoma model. N=3 mice per group and two tumours per mouse. Bars show mean+s.e.m. * indicates P<0.05 by two-tailed Student's t-test. (e) qRT-PCR assay showing induction of miR-103 transcript (pri-miR) in HUVECs over time after a single 20 Gy dose of radiation. Mean+s.e.m. of two biological replicates is shown (f) qRT-PCR of pri-miR-103 in HUVECs 1 h after indicated doses of radiation. One of two representative experiments (g,h) Phosphorylation of histone H2AX in HUVECs measured by immunofluorescence staining 24 h after ectopic expression of miR-103 (g) and inhibition of miR-103 (h) 3 h after exposure to the indicated doses of radiation. Bars show mean+s.e.m. of pixel area normalized to the number of nuclei for 25–50 nuclei per group. * indicates P<0.05 by two-tailed Student's t-test. qRT-PCR; quantitative real-time PCR.

