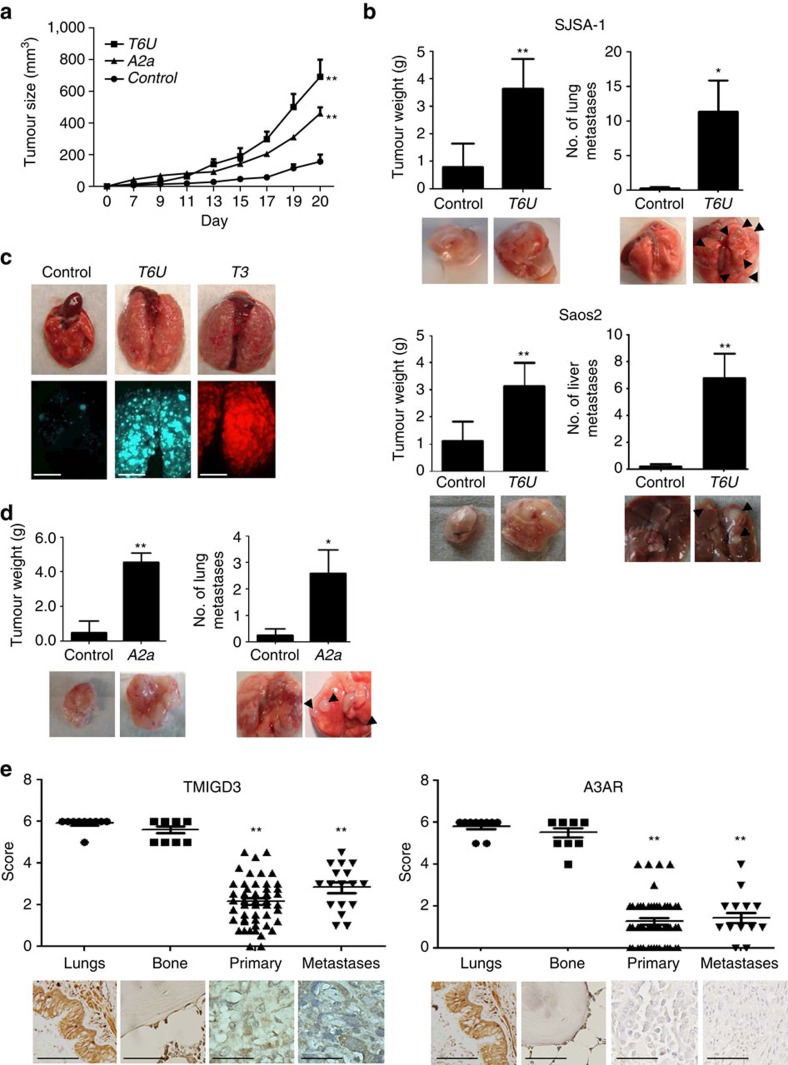
Figure 3. Association of reduced TMIGD3 or A3AR with OS malignancy.
(a) Subcutaneous tumour formation assays using SJSA-1 cells (5 × 10⁵) downregulated for non-silencing shRNA (Control), A3AR (A2a) or TMIGD3 (T6U). Tumours were measured twice a week until day 20 after injections. Error bars: means±s.d. (n=5 mice per group). **P<0.01; two-way analysis of variance (ANOVA). (b) Primary tumours and metastases following orthotopic injections of SJSA-1 (top, n=5 mice per group) and Saos2 (bottom, n=5 mice per group) cells with or without TMIGD3 knockdown (T6U). Cells (1 × 10⁵) were injected into femurs of NOD-scid IL2Rγnull (NSG) mice. Mice were killed ∼2 months (SJSA-1) or 5 months (Saos2) later, when thigh diameter became ∼2 cm in mice injected with TMIGD3 knockdown cells. Graphs showing primary tumour weight and number of metastatic nodules in the lungs (SJSA-1) or livers (Saos2). Representative images of primary tumours and metastases (arrows) below the graphs. Error bars: means±s.d. *P<0.05 and **P<0.01; Student's t-test (two-tailed). (c) Tail vein injection assays using SJSA-1 cells (5 × 10⁴) infected with non-silencing (control: GFP+, green), T6U (GFP+, green) or T3 (DsRed+, red) shRNAs. Mice (Control: n=7, T6U: n=7, T3: n=4) were killed 6 weeks later. Representative pictures of lungs (top) and images from a fluorescence dissecting stereo-microscope (bottom). Scale bar, 5 mm. (d) Primary tumours and metastases (arrows) following orthotopic injections of SJSA-1 cells (1 × 10⁵) with or without A3AR knockdown. Mice were monitored for ∼2 months. Graphs showing primary tumour weight and number of metastatic nodules in the lungs. Representative images of the primary tumours and metastatic nodules below the graphs. Error bars: means±s.d. (n=5 mice per group). *P<0.05 and **P<0.01; Student's t-test (two-tailed). (e) Immunohistochemistry (IHC) for TMIGD3 (left) and A3AR (right) in human OS and normal tissues. IHC analyses were performed independently in OS tissues (n=54 primary tissues and 17 metastases), as well as normal lung (n=10) and bone (n=10) tissues. Scoring was done on a scale of 0–6. Representative images of IHC are below the graphs. The horizontal lines in the plots represent the median. **P<0.01; one-way ANOVA. Scale bar, 50 μm.

