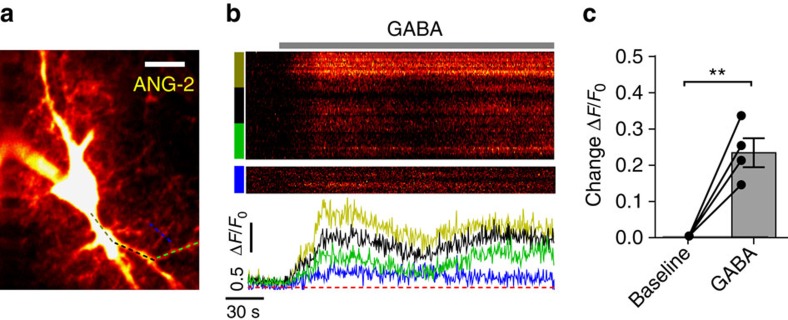
Figure 5. GABA induces Na+ rise in astrocytic processes.
(a) Example image of an astrocyte patch loaded with the Na+ indicator ANG-2, dashed colour-coded lines indicate analysed regions in (b). Scale bar, 10 μm. (b) Upper section: XY-T image displaying ANG-2 fluorescence intensity vs time, separated section shows Na+ signal in fine processes; contrast and brightness were altered to facilitate visualization of the weaker signal. Lower section: colour coded ΔF/F0 line plots match regions indicated by coloured bars/dashed lines in upper section and (a) respectively. (c) Summary plot of peak Na+ indicator response to 30 μM GABA application in fine processes of imaged astrocytes (n=4 cells from 4 animals). Error bars represent s.e.m.'s, **P<0.01 (paired t-test).

