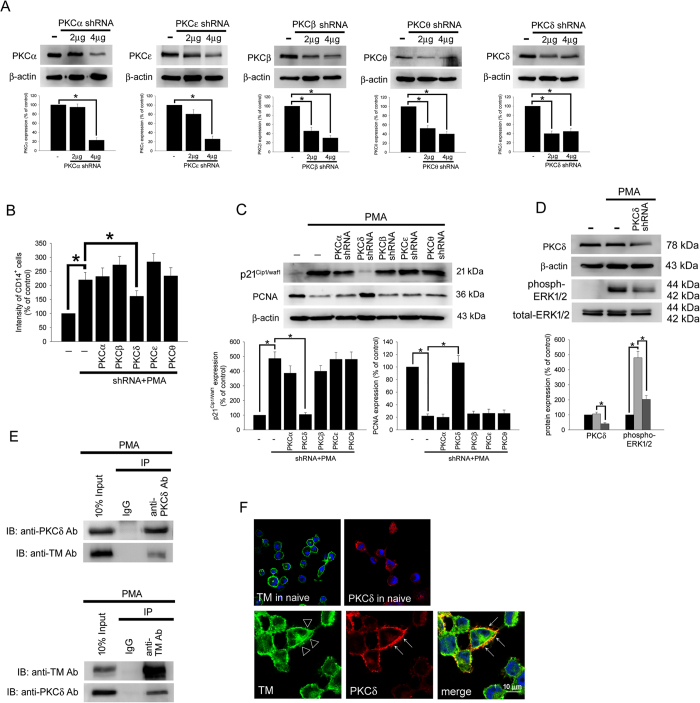
Figure 4. TM regulates THP-1 cell differentiation via the PKCδ-ERK1/2 signaling pathway.
(A) THP-1 cells were transfected with 2 or 4 μg of PKCα, PKCβ, PKCδ, PKCε, or PKCθ shRNA for 24 h. Total cell lysates were purified, and knockdown efficiency was assayed using western blot analysis. (B) The THP-1 cells were knocked down by PKCα, PKCβ, PKCδ, PKCε, and PKCθ shRNAs for 24 h followed by PMA stimulation for 72 hours. The number of CD14+ cells was scored using flow cytometry. Data are expressed as a % of the control, are presented as the mean ± SD and represent the results of five independent experiments (n = 5, *p < 0.05 was considered significant). (C) Different sets of THP-1 cells were transfected with 4 μg of each shRNA for 24 h followed by PMA stimulation for 72 hours. The levels of p21Cip1/WAF1 and PCNA were analyzed using western blot analysis. (D) The THP-1 cells were knocked down by PKCδ shRNA for 24 h followed by PMA stimulation for 72 hours. The level of PKCδ and total and phosphorylated ERK1/2 was analyzed using western blot analysis. In western blot analysis, β-actin and total-ERK1/2 were used as loading controls. The density of each band was quantified using densitometry and related protein expression was presented as bar graph. The data are presented as the mean ± SD, and *p < 0.05 was considered significant (n = 5). (E) Lysates of THP-1 cells with PMA stimulation were extracted. Left, immunoprecipitated using goat anti-PKCδ or goat IgG control antibodies followed by western blot analysis and detected using goat anti-PKCδ or rabbit anti-TM antibodies. Right, immunoprecipitated using rabbit anti-TM or rabbit IgG control antibodies followed by western blot analysis and detected using rabbit anti-TM or goat anti-PKCδ antibodies. Five independent experiments have been performed (n = 5). (F) THP-1 cells were treated without (upper photos) or with (lower photos) PMA for 72 hours. Subcellular distributions of TM (triangle) and PKCδ (arrow) in THP-1 cells were detected by immunofluorescence and observed by confocal microscopy. DAPI was used to stain the nuclei of THP-1 cells.

