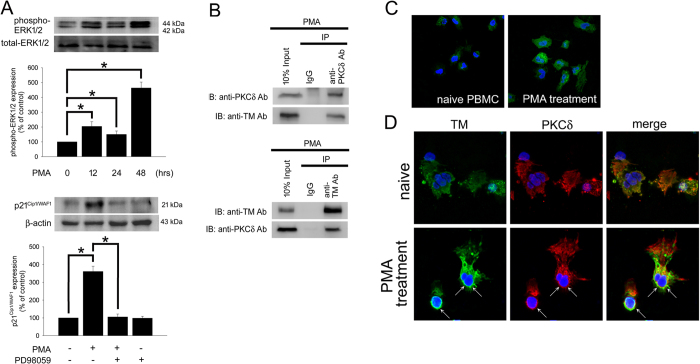
Figure 5. ERK1/2 regulates p21Cip1/WAF1 expression and PKCδ interacts with TM in PMA-stimulated PBMCs, which is consistent with those results in THP-1 cells.
(A) Human PBMCs were stimulated with 150 nM PMA for 12–48 h. Upper, the expression of phosphorylated ERK1/2 in total cell lysates were assayed using western blot analysis. Lower, human PBMCs were treated with 150 nM PMA, pretreated with 10 μM PD98059 for 1 h followed by PMA treatment, or treated with PD98059 alone for 48 h. A western blot assay was performed to determine the expression of p21Cip1/WAF1. The total-ERK1/2 and β-actin were used as loading controls. Three independent experiments (PBMCs from 3 voluntary donors) have been performed (n = 3), and representative images have been showed. The density of each band was quantified using densitometry and related protein expression was presented as bar graph. The data are presented as the mean ± SD, and *p < 0.05 was considered significant. (B) Lysates of PBMCs with 150 nM PMA stimulation for 24 hours were extracted. Upper, immunoprecipitated using goat anti-PKCδ or goat IgG control antibodies followed by western blot analysis and detected using goat anti-PKCδ or rabbit anti-TM antibodies. Lower, immunoprecipitated using rabbit anti-TM or rabbit IgG control antibodies followed by western blot analysis and detected using rabbit anti-TM or goat anti-PKCδ antibodies. (C) PBMCs were treated with 150 nM PMA for 24 hours. The expression of CD68 in PBMCs was detected by immunofluorescence and observed by confocal microscopy. (D) PBMCs were treated without (upper photos) or with (lower photos) PMA for 24 hours. Subcellular distributions of TM (arrow) and PKCδ (arrow) in PBMCs were detected by immunofluorescence and observed by confocal microscopy. DAPI was used to stain the nuclei of PBMCs. Three independent experiments (PBMCs from 3 voluntary donors) have been performed, and representative images were presented.

