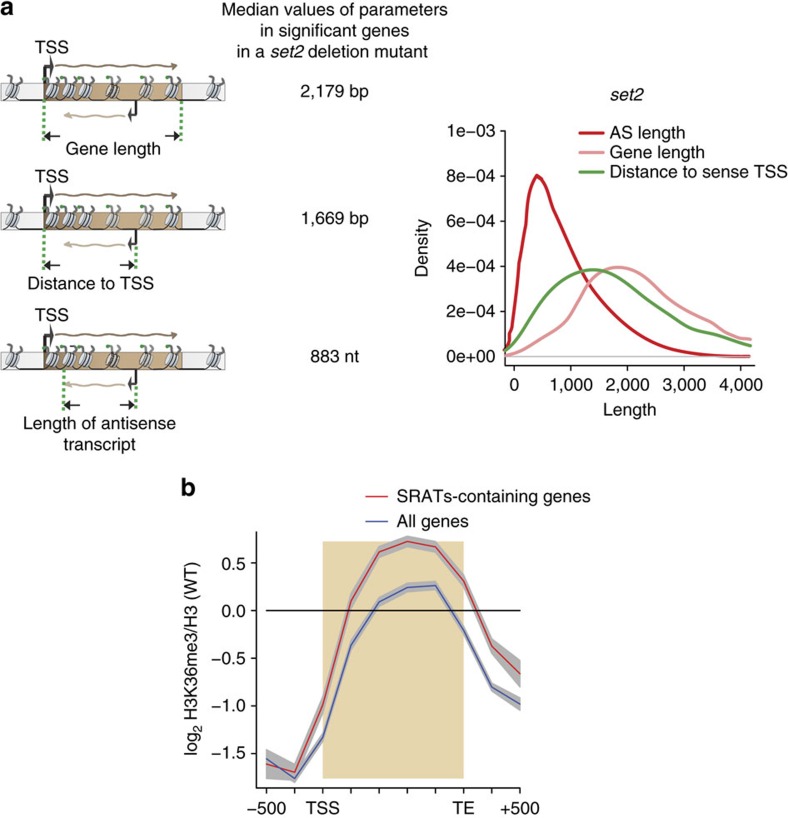
Figure 3. SRATs initiate and terminate within the coding regions of genes.
(a) On the left, a schematic representation of the three parameters used to define the SRAT relative to the coding region of genes—Gene length, distance to transcription start site (TSS) and the antisense length, and the median values based on our analysis from two independent repeats (see Methods). On the right, the density plots of the three parameters for the SRATs and their associated genes in the SET2 deletion mutant. (b). Gene average plot of the distribution of H3K36me3 normalized to H3 occupancy levels over a metagene from three independent biological repeats. The blue line traces the distribution over all coding genes in yeast, while the red line traces the distribution of H3K36me3 over the protein-coding genes that produce SRATs in a SET2 deletion mutant (n=853). The grey shading around each line indicates the 95% confidence interval.

