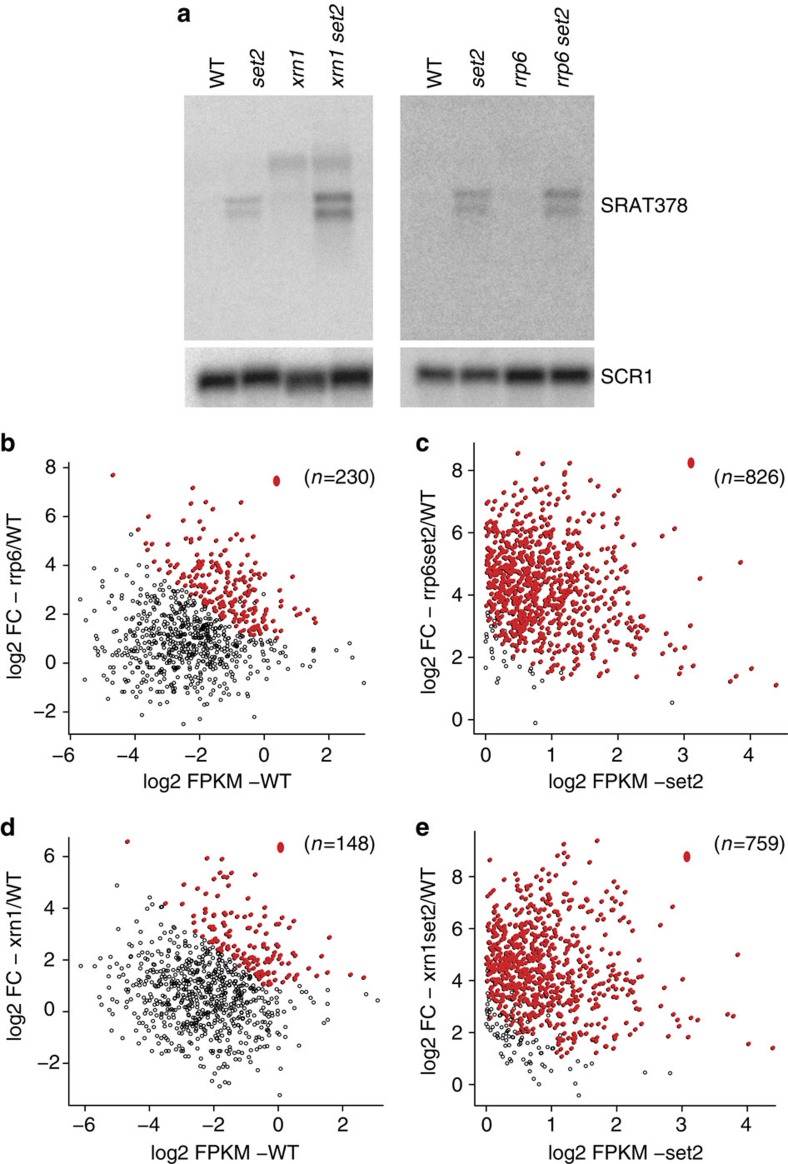
Figure 5. SRAT stability enhanced upon loss of RNA-degradation machinery.
(a) (Left) Strand-specific northern blot probing for SRAT378 using total RNA in either the wild-type (WT-BY4741), SET2 deletion mutant (set2), RRP6 deletion mutant (rrp6) and the RRP6 SET2 double deletion mutant (rrp6set2). (Right) Strand-specific northern blot probing for SRAT378 using total RNA in either the wild-type (WT-BY4741), SET2 deletion mutant (set2), XRN1 deletion mutant (xrn1) and the XRN1 SET2 double deletion mutant (xrn1set2). SCR1 is used as a loading control. (b–e). Scatter plots comparing the strand-specific RNA-Seq transcript abundance of SRAT a strain compared with the fold change in SRAT expression in the indicated mutant strains. The fold change of RNA abundance in indicated mutants with respect to the wild-type are distributed on the y axis, while RNA abundance of the wild-type (WT) (b,d) or SET2 deletion (set2) (c,e) are distributed on the x axis. The red dots indicate the SRATs that are significantly upregulated in the mutant on the y axis. The total number of SRATs used in the analysis is denoted above each plot.

