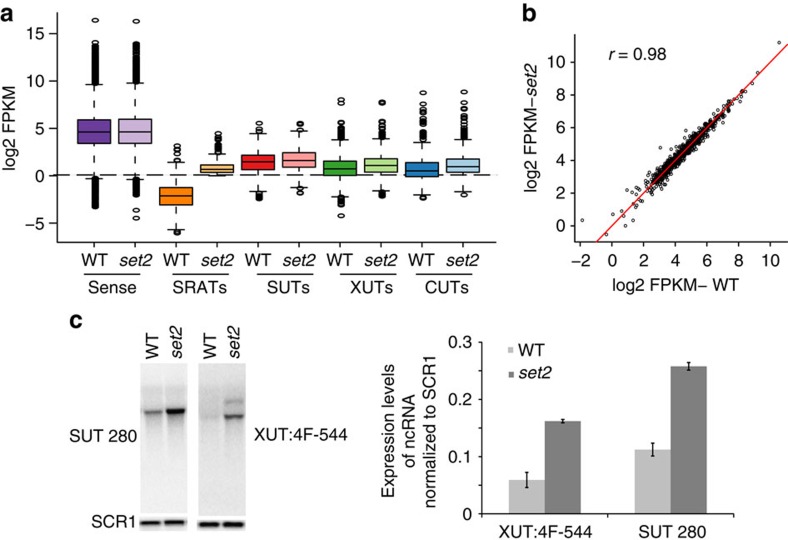
Figure 6. Effect of SET2 deletion on ncRNA production in yeast.
(a). Boxplots showing the abundance of the different RNA species as indicated, produced in either the wild-type or SET2 deletion yeast strain. (b) Scatter plot with the abundance of sense protein-coding genes (Log2 FPKM) of wild-type in the x axis and SET2 deletion mutant in the y axis. The red line denotes the values where x=y. The Spearman coefficient of correlation is provided. (c) (Left) Strand-specific northern blot probing for SUT280 and the XUT, 4F-544 using total RNA in either the respective wild-type or SET2 deletion mutant (set2). SCR1 is used as a loading control. (Right) Quantitation of strand-specific northern blots indicating the expression level of selected ncRNAs, normalized to the level of SCR1 in total RNA under the indicated conditions. Error bars denote the s.e.m. of three independent repeats.

