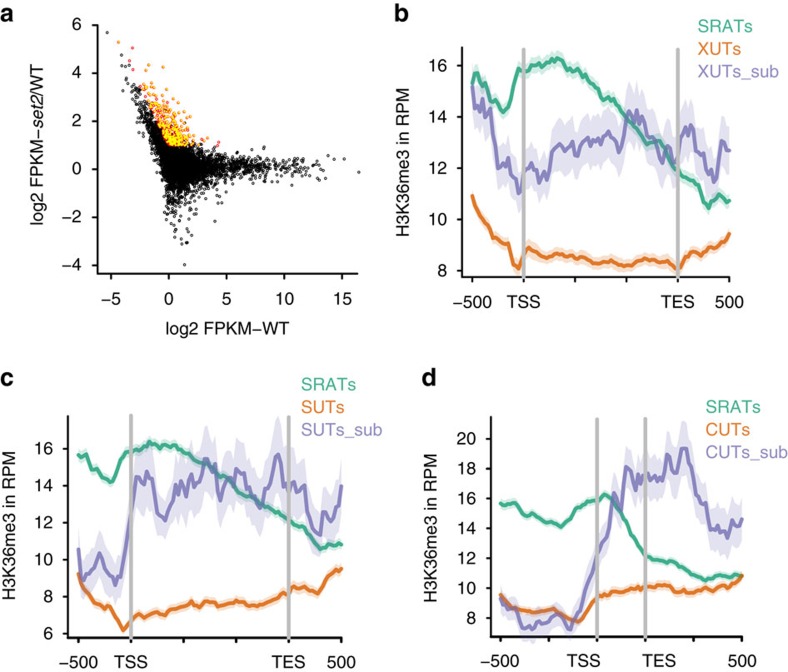
Figure 7. Expression of overlapping sense genes suppresses antisense transcription by H3K36 methylation.
(a) Scatter plot denoting the wild-type transcript abundance of CUTs, SUTs and XUTs on the x axis, and the fold change of each of these transcripts in the SET2 deletion mutant on the y axis. Transcripts that are significantly upregulated using the defined cutoffs are marked as red circles (n=347). Transcripts that have an overlapping protein-coding gene overlapping the ncRNA are marked with filled yellow circles. (b). Metagene plots denoting the distribution of H3K36 me3 mark over the promoters and gene bodies of SRATs (green), XUTs (orange), and a subset of XUTs (XUT_sub, n=121) that are upregulated upon loss of Set2 (blue). (c) Metagene plots denoting the distribution of H3K36 me3 mark over the promoters and gene bodies of SRATs (green), SUTs (orange) and a subset of SUTs (SUT_sub, n=48) that are upregulated upon loss of Set2 (blue). (d) Metagene plots denoting the distribution of H3K36 me3 mark over the promoters and gene bodies of SRATs (green), CUTs (orange) and a subset of CUTs (CUT_sub, n=52) that are upregulated upon loss of Set2 (blue). The lighter areas surrounding the traces in all three figures denote the 95% confidence interval of the traces.

