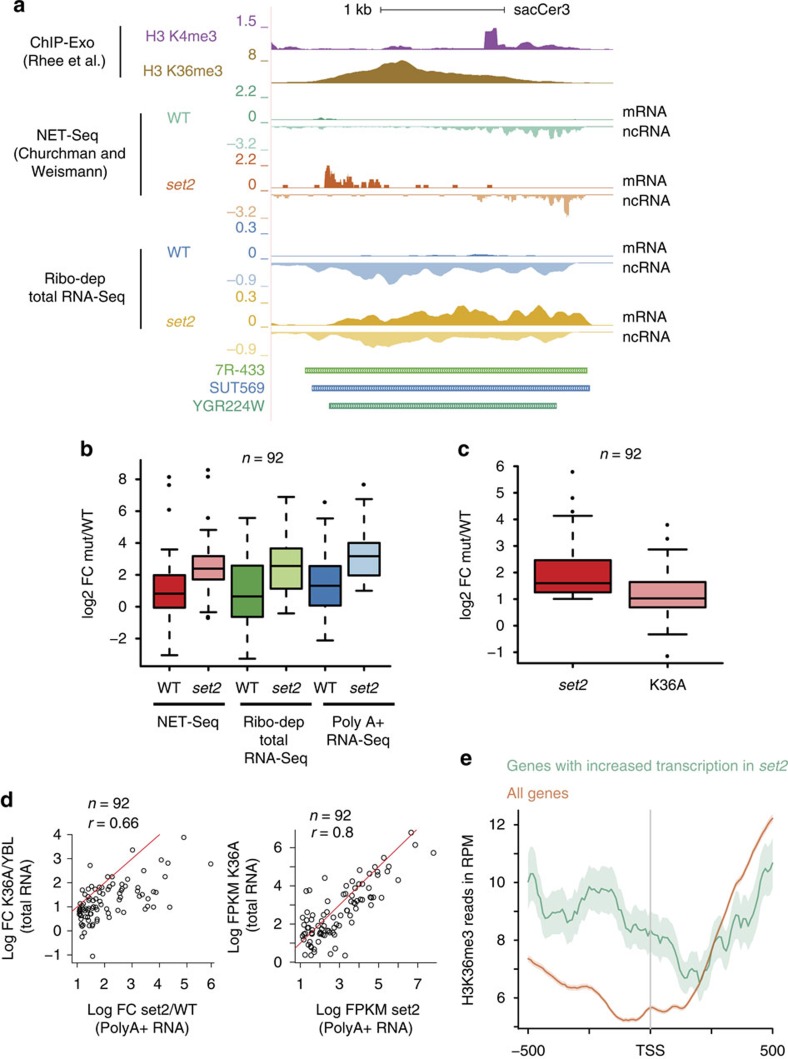
Figure 8. Interleaved transcription suppresses gene expression by adding H3 K36 methylation.
(a) Genome browser profile showing the histone modifications and transcripts (NET-Seq and ribodepleted) produced in wild-type strain (WT) and the SET2 (set2) over the gene AZR1. The modifications are reanalysed tracks from ref. 33. Each transcript track is separated into the sense strand (mRNA) on top, running from left to right and the antisense strand (ncRNA) in the bottom running from right to left. Both strain produce a SUT or XUT that encompasses the AZR1 gene. Loss of Set2-mediated H3K36me3 results in a de-repression of the protein-coding transcript. (b) Boxplot showing the abundance (RNA-Seq and PolyA-enriched RNA-Seq) or transcription levels (NET-Seq) in sense gene expression (log2 FC mut/WT) of 92 genes with overlapping transcripts in the SET2 deletion (set2) versus the wild-type for each data set as indicated. (c) Boxplot showing the fold-change in sense gene expression (log2 FC mut/WT) of 92 genes with overlapping transcripts in the SET2 deletion (set2) and H3K36A (K36A) mutants for each data set as indicated. (d) Scatter plots either denoting the fold change (Log FC) in gene expression (left) or the transcript abundance (Log FPKM, right) of the 92 protein-coding genes with overlapping transcripts. The respective values from the SET2 deletion mutant are distributed on the x axis, while those from the H3K36A mutant are distributed on the y axis. The red line denotes the values where x=y. The Spearman coefficient of correlation is provided. (e) Metagene plots denoting the distribution of H3K36me3 mark around the promoters (upto 500 bp on either side) of all protein-coding genes (orange) or a subset of genes that are upregulated upon loss of Set2 (green). The lighter areas surrounding the traces denote the 95% confidence interval of the traces.

