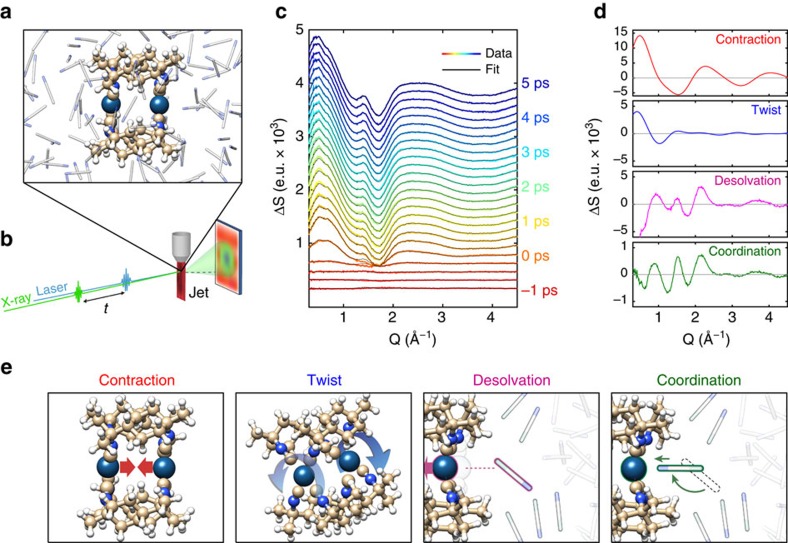
Figure 1. Scheme and results of the XDS experiments on [Ir2(dimen)4]2+.
(a) Shows a snapshot of [Ir2(dimen)4]2+ in acetonitrile solution from BOMD simulations. (b) Shows the experimental set-up. (c) Shows the recorded difference scattering data and fit, each consecutive curve has been offset by 150 e.u. for visibility. (d) Shows examples of the four components used to fit the data; The contraction signal is simulated for a 4.2 to 2.9 Å contraction of the Ir–Ir distance with no change in the ligand twist. The ligand twist component is simulated for a 0 to 15° degree increase in the N-Ir-Ir-N ligand dihedral twist at an Ir–Ir distance of 2.9 Å. The two solute components are extracted directly from the analysis. (e) Shows a sketch of four dynamics giving rise to the signals presented in d.

