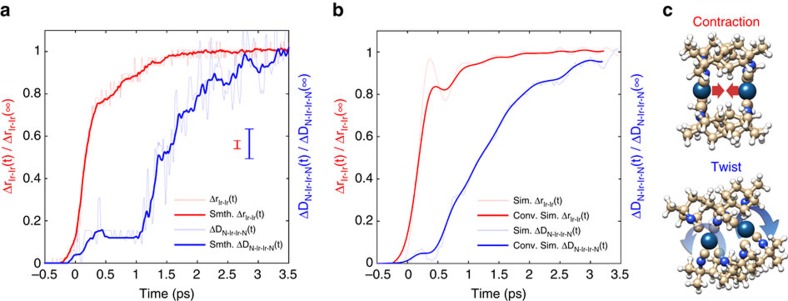
Figure 2. Molecular structural dynamics of photoexcited [Ir2(dimen)4]2+.
(a) The Ir–Ir contraction (red) and the N-Ir-Ir-N dihedral twist (blue) determined from the XDS analysis. The full curves show the 15-point (∼120 fs) smoothed result, with the parameter uncertainty being estimated by the point-to-point variation. Vertical lines show the average standard error at each time delay. (b) Ir–Ir contraction (red) and N-Ir-Ir-N dihedral twist (blue) determined from BOMD simulations (shaded lines) and the results from BOMD after convoluting the signal with the IRF of the experiment (full lines). (c) Schematic depiction of the contraction and twist distortions.

