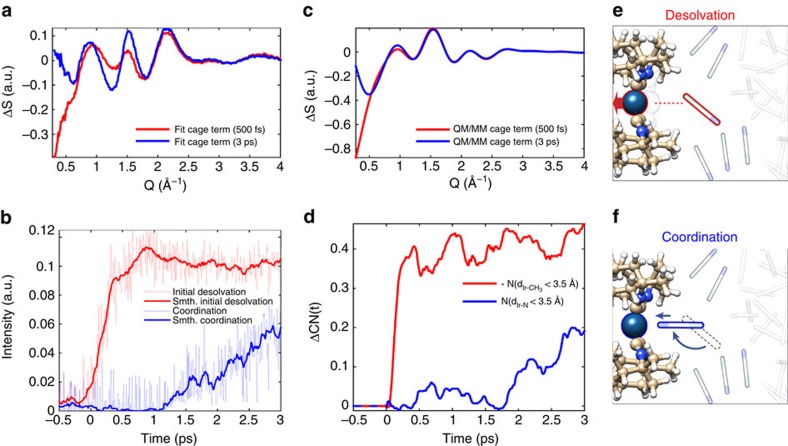
Figure 3. Solvation dynamics of photoexcited [Ir2(dimen)4]2+ in acetonitrile.
(a) Solvation cage signal extracted from the difference scattering data recorded at time delays of 500 fs and 3 ps. (b) Evolution of the two experimentally determined solvation components. Full curves show the 15-point smoothed result, with the uncertainty being estimated by the point-to-point variation in the fit shown as transparent curves. (c) Simulated difference scattering from the solvent cage of the BOMD simulations for time delays of 500 fs and 3 ps. Simulated signal has been scaled by the 13% excitation fraction to facilitate comparison with cage term extracted from data. (d) Change in coordination number (CN) of the Ir atoms, by the methyl and nitrogen groups of the acetonitrile solvent after the excitation as predicted by the BOMD simulations (note that the methyl coordination change is negative). (e,f) Schematic depiction of the processes giving rise to the solvation signal measured in the difference scattering data; (e) An initial loss of solvation of the Ir atoms of [Ir2(dimen)4]2+ by the methyl groups of the acetonitrile solvent and (f) a coordination of the Ir atoms of the excited state [Ir2(dimen)4]2+ by the nitrogen groups of the acetonitrile solvent.

