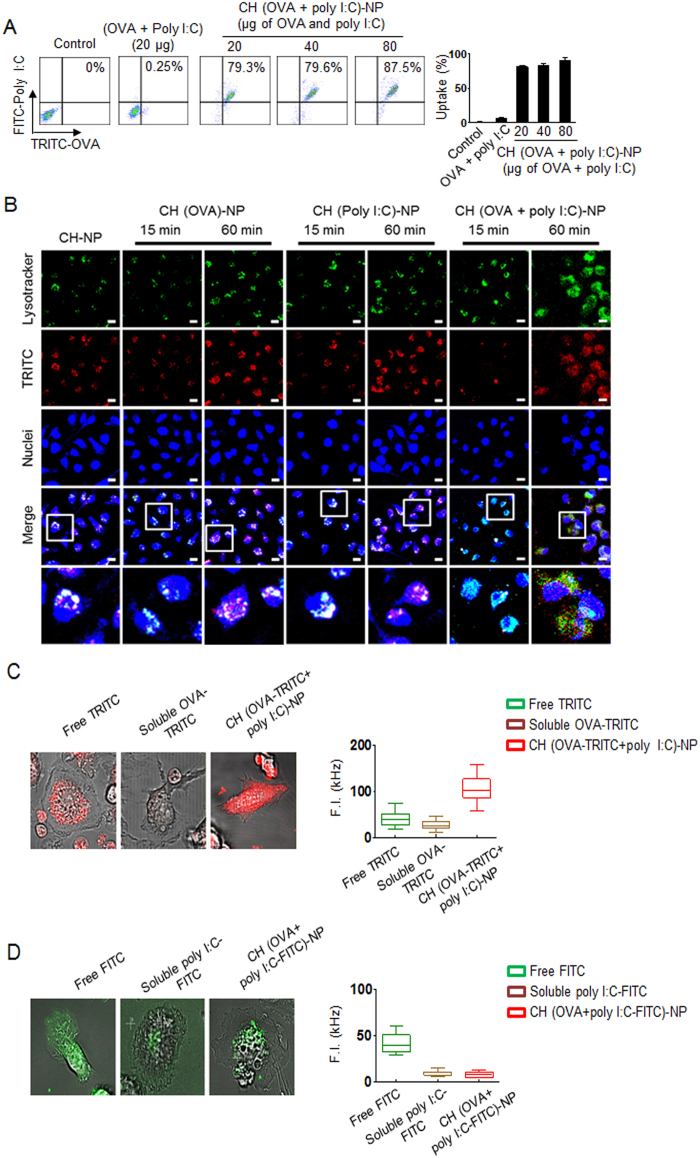
Figure 2. Intracellular delivery of CH (OVA+poly I:C)-NPs into DCs.
(A) Efficiency of intracellular delivery of CH (OVA+poly I:C)-NPs into DC. OVA was labeled with TRITC, and poly I:C was labeled with FITC as indicators for visualization. (B) A photograph of Intracellular delivery of CH (OVA+poly I:C)-NPs into DCs. Red: TRITC-labeled OVA or TRITC-labeled poly I:C. Blue: nuclei. Scale bar: 10 μm. (C) Cytosolic distribution of TRITC-labeled OVA released from CH (OVA+poly I:C)-NPs after 1 hr intracellular trafficking in live DCs, and mean fluorescence intensity of the region of interest (ROI) in the cytosol of DCs. (D) Cytosolic distribution of FITC-labeled poly I:C released from CH (OVA+poly I:C)-NPs after 1 hr intracellular trafficking in live DCs and mean fluorescence intensity of the ROI in the cytosol of DCs. Error bars represent s.e.m.

