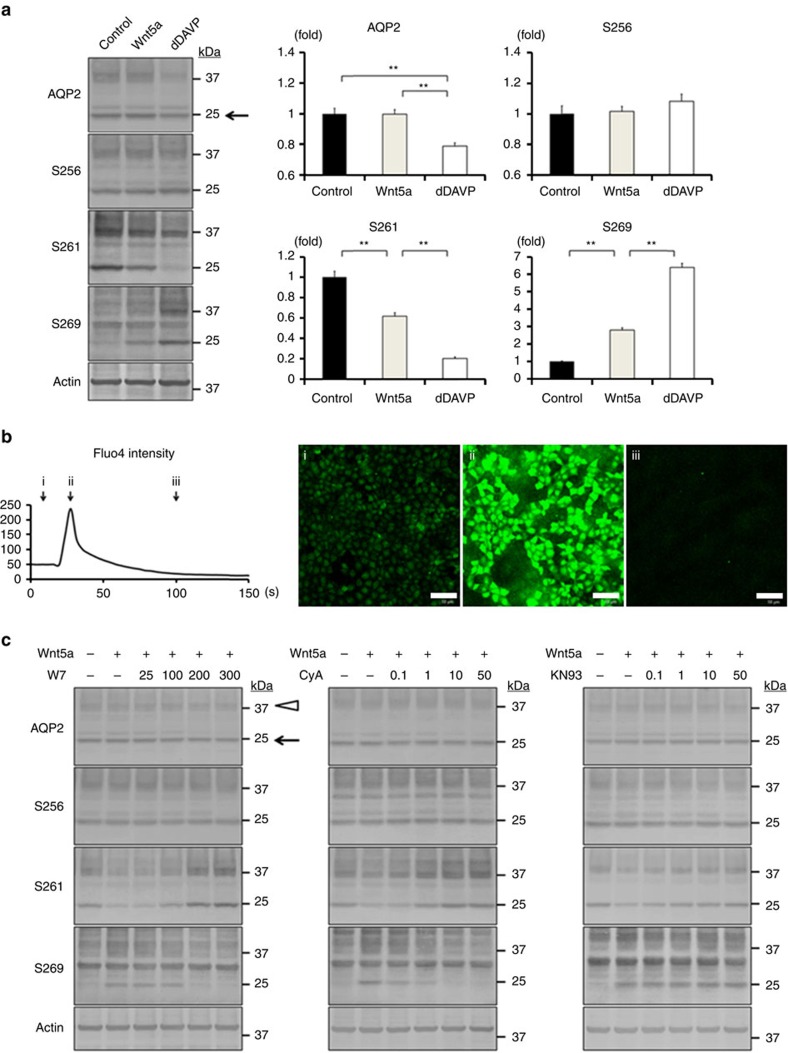
Figure 1. Wnt5a alters AQP2 phosphorylation through the activation of calcium signalling.
(a) Western blot analysis of total and phosphorylated AQP2. (Left) Wnt5a (500 ng ml−1) or dDAVP (1 nM) was added to the basolateral side of the mpkCCD cells for 1 h. (Right) Non-glycosylated AQP2 bands (arrow) were quantified by densitometric analysis, and the results are presented in the bar graphs as fold change compared with the value in the control cells. Error bars are mean values±s.d. from three experiments. Tukey, **P<0.01. (b) The increase of Fluo4 intensity. (Left) Wnt5a (500 ng ml−1) was added to the mpkCCD cells. The time-course of Fluo4 fluorescence intensity is shown. The x axis indicates time, and the y axis indicates Fluo4 intensity. (Right) Representative confocal images at the indicated time (arrow) are shown. Scale bars, 50 μm. (c) Dose–response studies of W7, CyA, and KN93. Wnt5a (500 ng ml−1) was added in the presence or absence of W7 (25–300 μM), CyA (0.1–50 μM), or KN93 (0.1–50 μM) for 1 h. The mpkCCD cells were pretreated with each inhibitor for 45 min before Wnt5a stimulation. Representative blots of three independent experiments are shown.

