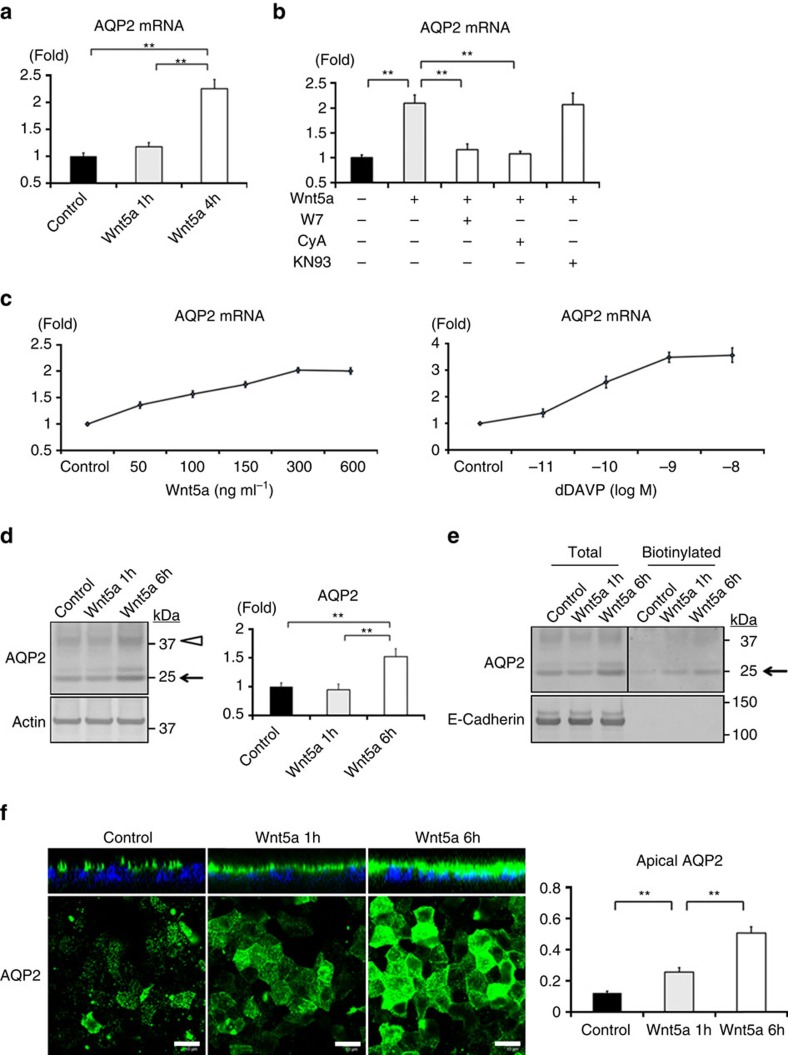
Figure 3. Wnt5a increases AQP2 mRNA and protein expression.
(a) Wnt5a-induced AQP2 mRNA expression. The mpkCCD cells were treated with Wnt5a (500 ng ml−1) for 1 or 4 h. AQP2 mRNA expression was examined by quantitative real-time PCR. Results are presented as fold change compared with the value in the control cells. Error bars are mean values±s.d. from three experiments. Tukey, **P<0.01. (b) Inhibition of Wnt5a-induced AQP2 mRNA expression by W7 and CyA. Wnt5a (500 ng ml−1) was added to the mpkCCD cells in the presence or absence of W7 (50 μM), CyA (10 μM), or KN93 (10 μM) for 4 h. The mpkCCD cells were pretreated with each inhibitor for 45 min before Wnt5a stimulation. AQP2 mRNA expression was analyzed as in a. Bars are mean values±s.d. from four experiments. Tukey, **P<0.01. (c) Dose–response curves of AQP2 mRNA expression in response to Wnt5a or dDAVP. The mpkCCD cells were treated with the indicated concentrations of Wnt5a or dDAVP for 4 h. AQP2 mRNA expression was analyzed as in a. The x axis indicates the concentration of the Wnt5a or dDAVP, and the y axis indicates the relative fold change of the AQP2 mRNA. Each value is presented as mean±s.d. from three experiments. (d) Wnt5a-induced AQP2 protein expression. (Left) The mpkCCD cells were treated with Wnt5a (500 ng ml−1) for 1 or 6 h. (Right) Densitometric analysis of non-glycosylated AQP2 bands (arrow) are presented in the bar graphs as fold change compared with the value in the control cells. Error bars are mean values±s.d. from three experiments. Tukey, **P<0.01. (e) Biotinylation analysis of Wnt5a-induced apical AQP2 expression. The mpkCCD cells were treated with Wnt5a (500 ng ml−1) for 1 or 6 h. The amount of AQP2 in the apical plasma membrane was quantitated by apical surface biotinylation. Representative blots of three independent experiments are shown. (f) Immunofluorescent analysis of Wnt5a-induced apical AQP2 expression. (Left) The mpkCCD cells were treated with Wnt5a (500 ng ml−1) for 1 or 6 h. Immunofluorescence staining of AQP2 was analyzed as in Fig. 2. Scale bars, 10 μm. (Right) Fluorescence intensities of apical AQP2 were quantified, and the results are presented in the bar graphs. Error bars are mean values±s.d. from three experiments. Tukey, **P<0.01.

