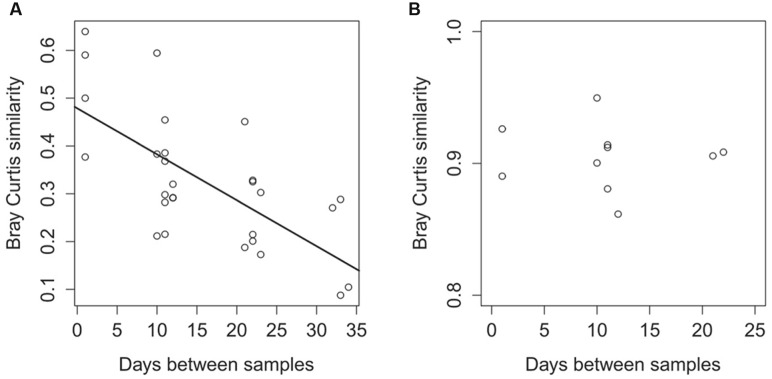
FIGURE 3.
Differences in the taxonomic community composition between samples (A) and differences in the functional community composition (B) in relation to the time separating the samples. Differences in the community composition are calculated with the Bray-Curtis similarity index based on 16S rRNA sequences for the taxonomic comparison (A) and are based on the functional genes from the metagenomes annotated against the KEGG Orthology database (B).

