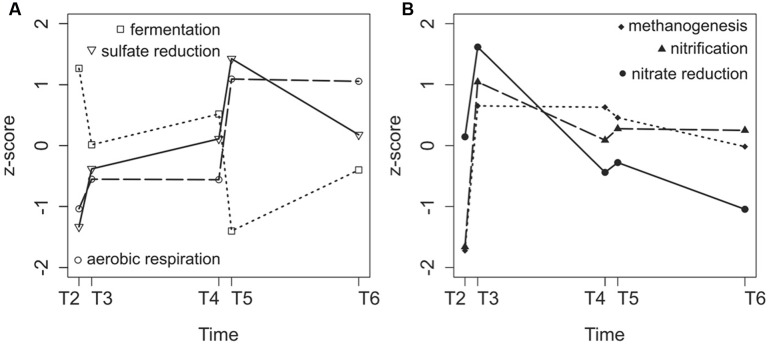
FIGURE 6.
Variation in fermentation, sulfate reduction and aerobic respiration gene sequence numbers (A) and methanogenesis, nitrification and nitrate reduction gene numbers (B) expressed as z-scores during the course of the experiment (T2–T6). Sequence counts were obtained after annotating metagenomes against the KEGG Orthology database.

