
Fig. 1.
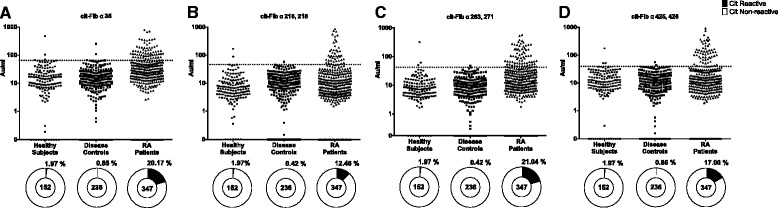
Levels and percentage reactivity of serum antibodies against the different citrullinated fibrinogen (cit-Fib) peptides. Comparison of the levels of antibodies against the four different cit-Fib peptides in serum from patients and controls (a. cit-Fib α35; b. cit-Fib α216;218; c. cit-Fib α263, 271; d. cit-Fib α425, 426). Horizontal dotted line indicates the ELISA cutoff for positivity towards the cit-peptide. Pie charts (bottom) represent the percentage positivity in each cohort. Number of individuals is indicated in the centre of the pie chart. RA rheumatoid arthritis