
Fig. 2.
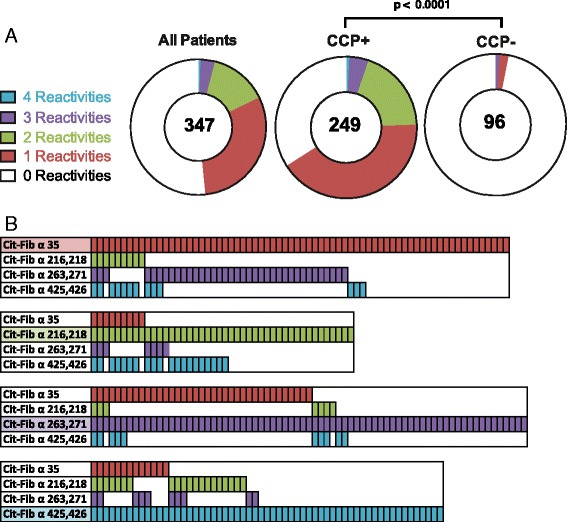
Serum reactivity to multiple citrullinated fibrinogen (cit-Fib) epitopes. a. Pie charts indicate the proportion of serum samples that were reactive with multiple cit-Fib peptides. The total number of individuals is indicated in the centre of the pie chart. The p value indicates the result from a chi square test comparing the multiple reactivates in anti-citrulline protein antibody (ACPA)-positive vs ACPA-negative individuals. b. Illustration of the multiple reactivity seen in individuals positive for antibodies against each cit-Fib peptide. CCP cyclic citrullianted peptides