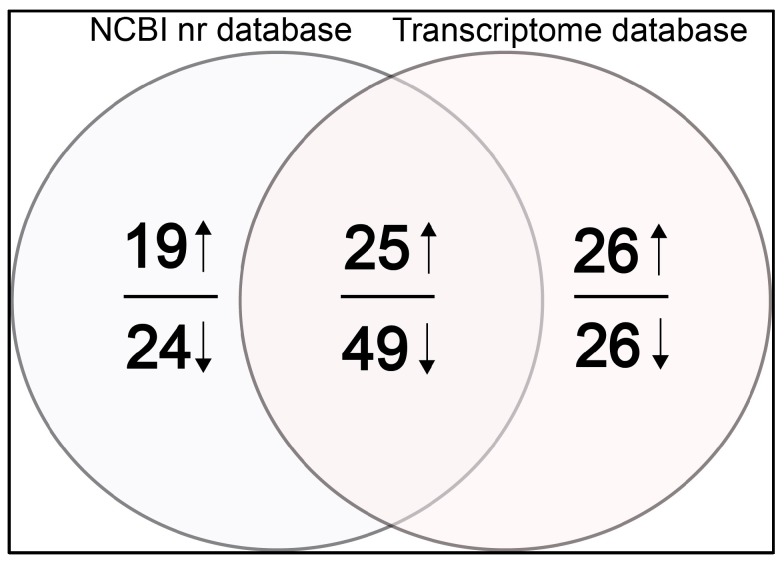
Figure 1.
Venn diagram showing the number of total differentially expressed proteins identified by tandem mass spectrometry (MS/MS) between the NCBI nr database and transcriptome database. The overlapping regions indicate the number of shared proteins. The number above or below the horizontal line in each portion indicates the number of up- or down-regulated proteins respectively. In total, 117 and 126 proteins were identified from the NCBI nr database (Table S1) and transcriptome database (Table S2), respectively. Seventy-four proteins were identified from both databases. Among the 74 common proteins, 25 were up-regulated and 49 down-regulated. Among the 43 NCBI-specific proteins, 19 were up-regulated and 24 down-regulated. Among the 52 transcriptome-specific proteins, 26 were up-regulated and 26 down-regulated.

