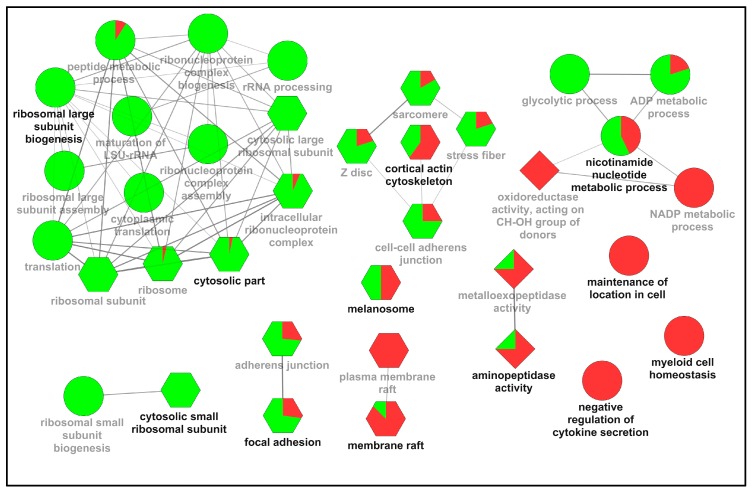
Figure 2.
Enriched Gene Ontology (GO) network groups using ClueGO. GO categories of the identified up- and down-regulated proteins in the potentiated pedicle periosteum cells (PPPCs) are visualized as a functionally grouped network; only the terms that have p-value ≤0.05 are shown. Nodes in different shapes (ellipse: biological processes; hexagon: cell component; diamond: molecular function) represent specific GO terms and are grouped based on their similarity. The most significant parent or child term in each group is shown in bold, and the group is named after it. The thickness of the lines linking groups represents the value of calculated kappa score. The proportions of up- or down-regulated proteins in each GO term are indicated by red or green, respectively.

