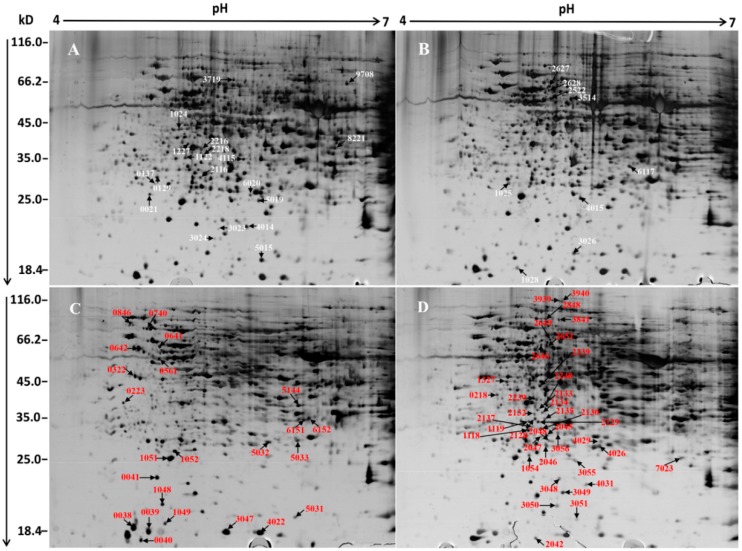
Figure 2.
Representative 2-DE profiles of proteins in G. biloba. The molecular mass (Mr) in kDa and pI of proteins are indicated on the left and top, respectively. The identified proteins are annotated by a number and arrow. (A) Total proteins from YL; (B) Total proteins from GL; (C) Chloroplast proteins from YL; (D) Chloroplast proteins from GL. The arrows indicate increased protein spots in ginkgo.

