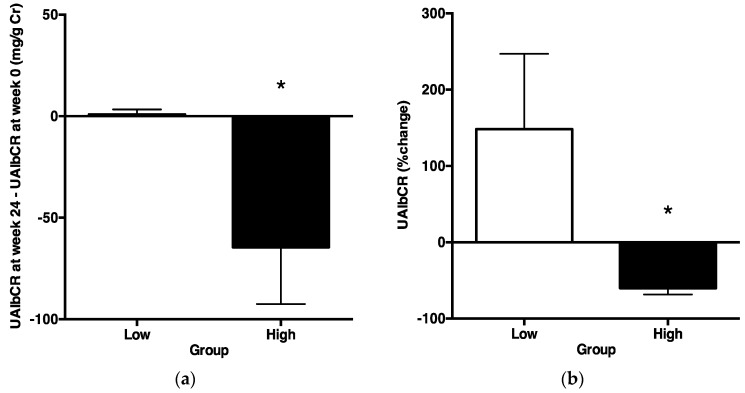
Figure 6.
ΔUrinary albumin/creatinine ratio and % change in the urinary albumin/creatinine ratio portioned by the cutoff value of the urinary angiotensinogen/creatinine ratio before treatments. They were compared between thetwo2 groups using the unpaired t-test. p < 0.05 was considered as statistically significant. (a) The ΔUrinary albumin/creatinine ratio was significantly lower in Group H than in Group L; (b) in addition, the % change in the urinary albumin/creatinine ratio was significantly lower in Group H than in Group L (* p < 0.05).

