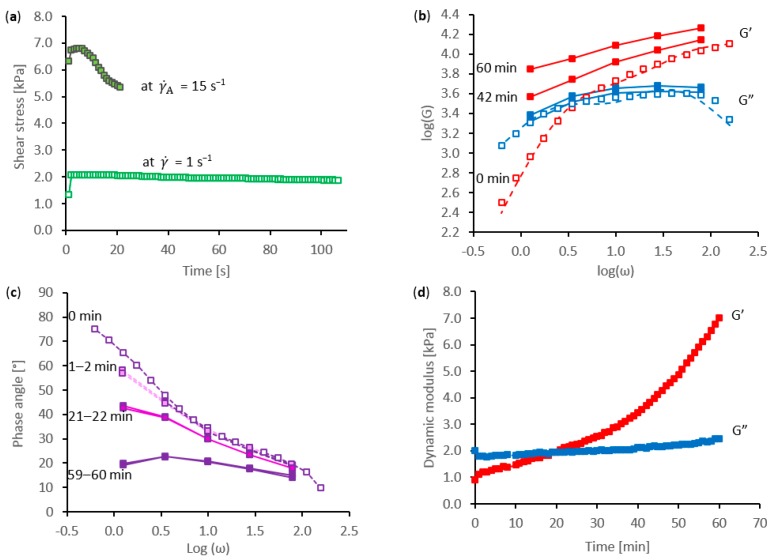
Figure 1.
Rheological demonstration of shear-induced phase change: (a) shear stress during steady flow at shear rates of 1 and 15 s−1, where the latter period of high shear stress initiated the phase change; (b) examples of dynamic moduli; (c) examples of frequency dependence of the phase angle; (d) progressive changes in dynamic moduli measured at 0.2 Hz (1.25 rad·s−1). Open points indicate initial data prior to initiation; filled points indicate data during the phase change.

