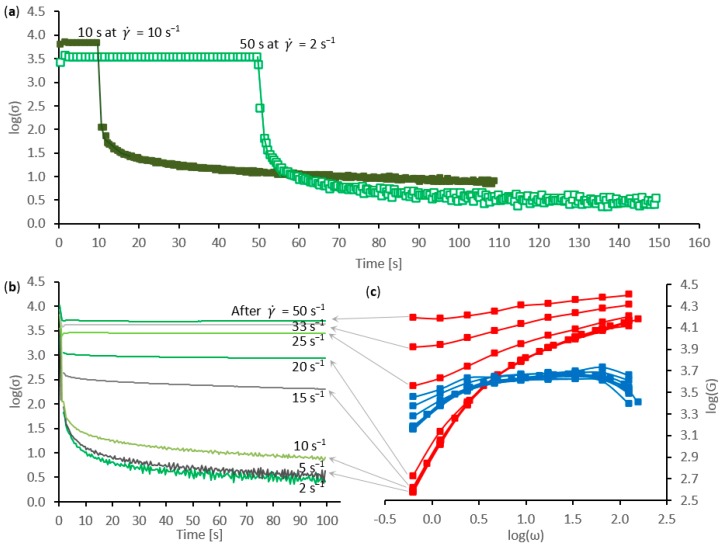
Figure 4.
Sequences of stress and oscillatory measurements for a silk feedstock specimen during shear-induced phase change: (a) shear stress during constant shear flow (at = 2 or 10 s−1, corresponding to a total strain of 100), followed by quasi-static relaxation (over 100 s at = 0.0005 s−1); (b) comparison between quasi-static stress relaxation and (c) oscillatory data (G’ in red, G” in blue), for a silk feedstock sample following periods of shear flow at increasing shear rates.

