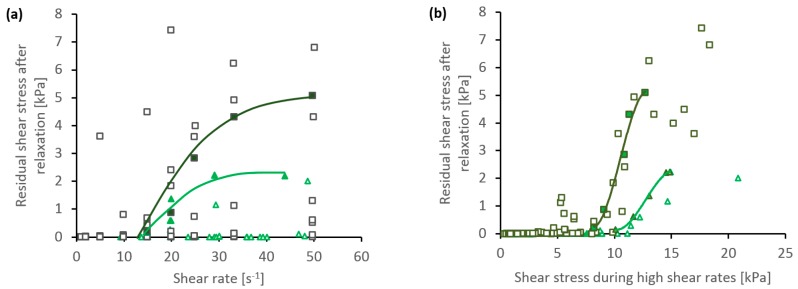
Figure 5.
Comparison between residual stress after quasi-static relaxation (100 s at = 0.0005 s−1) and (a) shear rate or (b) shear stress during the periods of faster flow (of total strain 30 or 100, shown as triangles or squares, respectively). Filled points represent exemplar data from individual experiments; open points represent aggregated data from several experiments. The continuous lines show trend lines for the exemplars.

