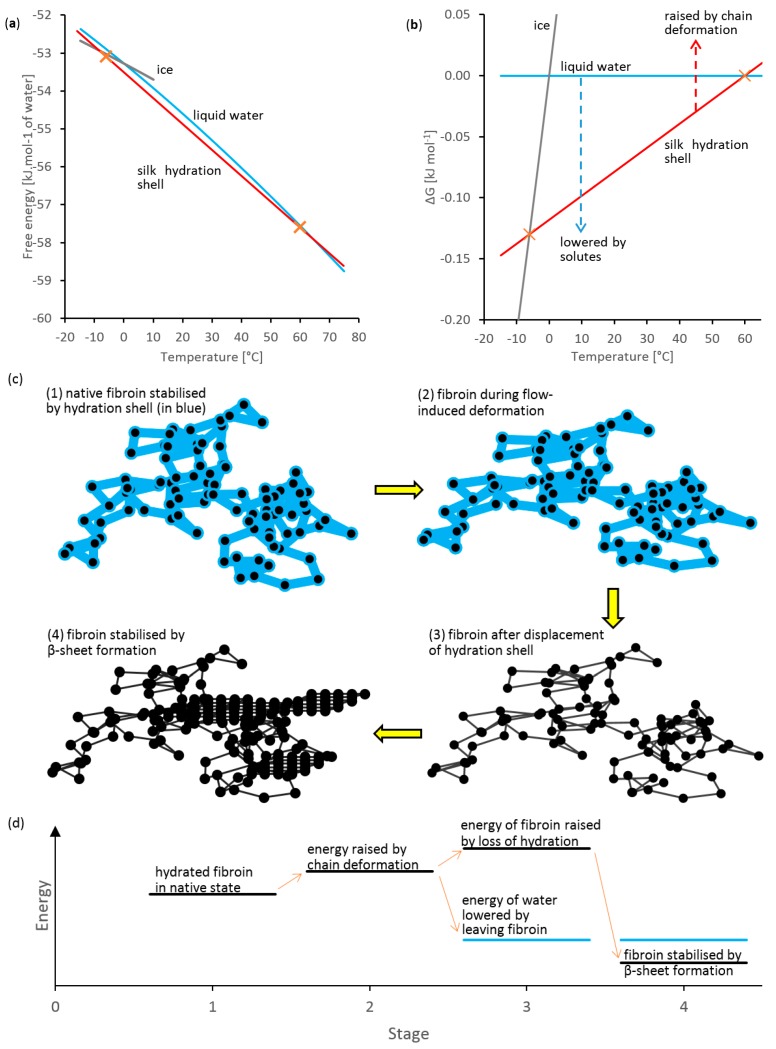
Figure 8.
Representative illustration of entropy-driven de-solvation hypothesis: (a) free energy vs. temperature plots for ice (grey), water (blue) and fibroin hydration shell (red); (b) free energy change from liquid water to ice and hydration shell (assuming linear interpolation); (c) representing four stages of flow-induced coagulation (random coil, native hydrated fibroin, flow-induced chain deformation, loss of hydration and β-sheet formation); (d) corresponding energy changes.

