Figure 1.
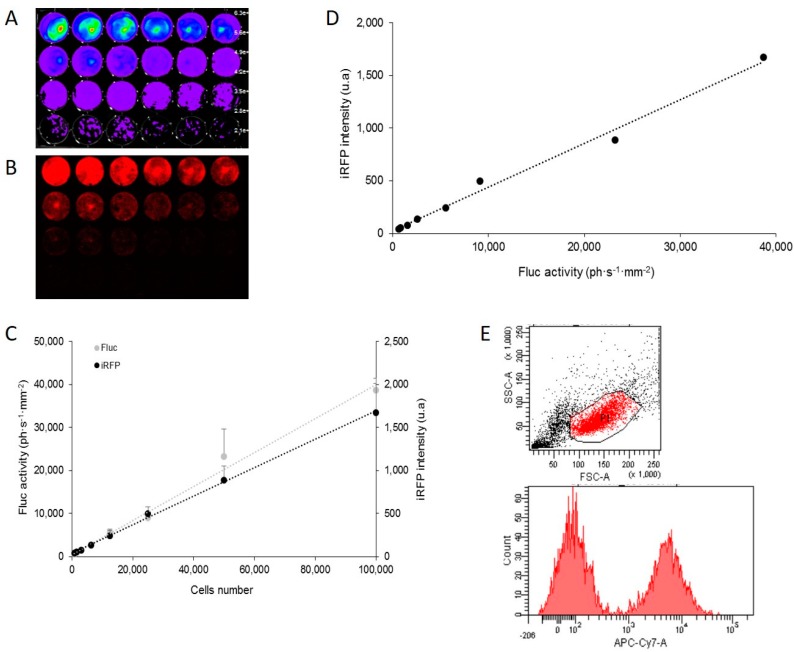
In vitro correlation between firefly luciferase (Fluc) activity and infrared fluorescent protein (iRFP) expression in U87-iRFP+-Fluc+ cells. Bioluminescence imaging (BLI) (A) and fluorescence reflectance imaging (FRI) (B) of successive dilutions (1:2) of U87-iRFP+-Fluc+ cells (from 781 to 100,000 cells) two days after plating. Fluorescent signals of iRFP and Fluc activities were plotted versus cell number (C). Fluorescent signals of iRFP were plotted versus bioluminescence signals (D). Representative distribution of iRFP-expressing cells (E) was determined by flux cytometry (10,000 cells). u.a, units arbitrary.

