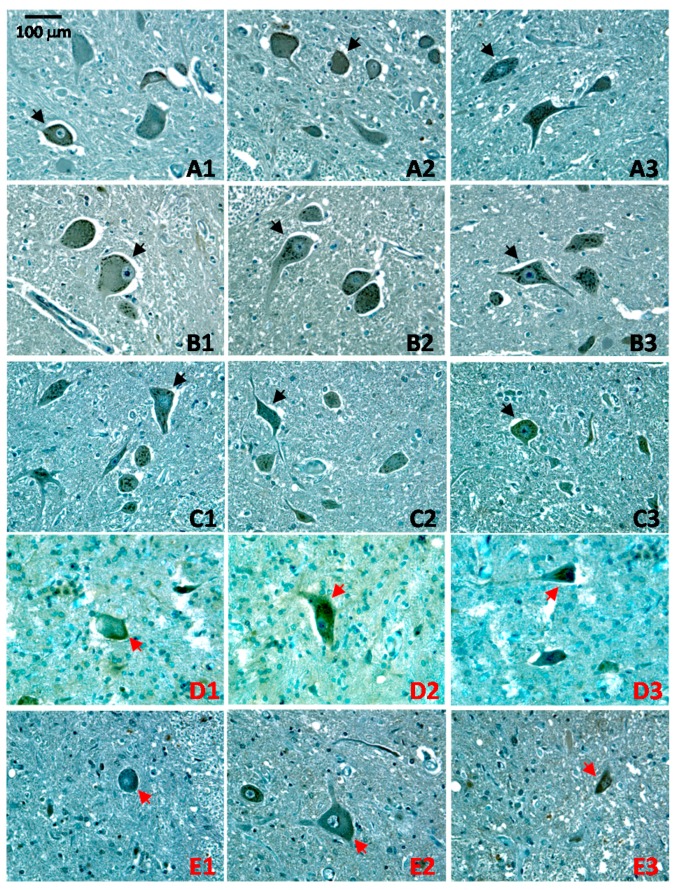
Figure 4.
Altered CA1-immunoreactive patterns in ALS pathology. Spinal cord sections were immunohistochemically stained for CA1-immunoreactivity (brown, GαCA1, 1:500) and counter-stained with hematoxylin (blue). Three randomly selected images (indicated by 1–3) were shown for each sample. Samples labeled in black (A–C) are from control subjects; and those labeled in red (D–E) are from ALS patients. Neurons with the normal punctate CA1-immunoreactive distribution are indicated by black arrows and those with altered CA1-immunoreactive pattern were indicated by red arrows. The black scale bar indicates 100 μm.

