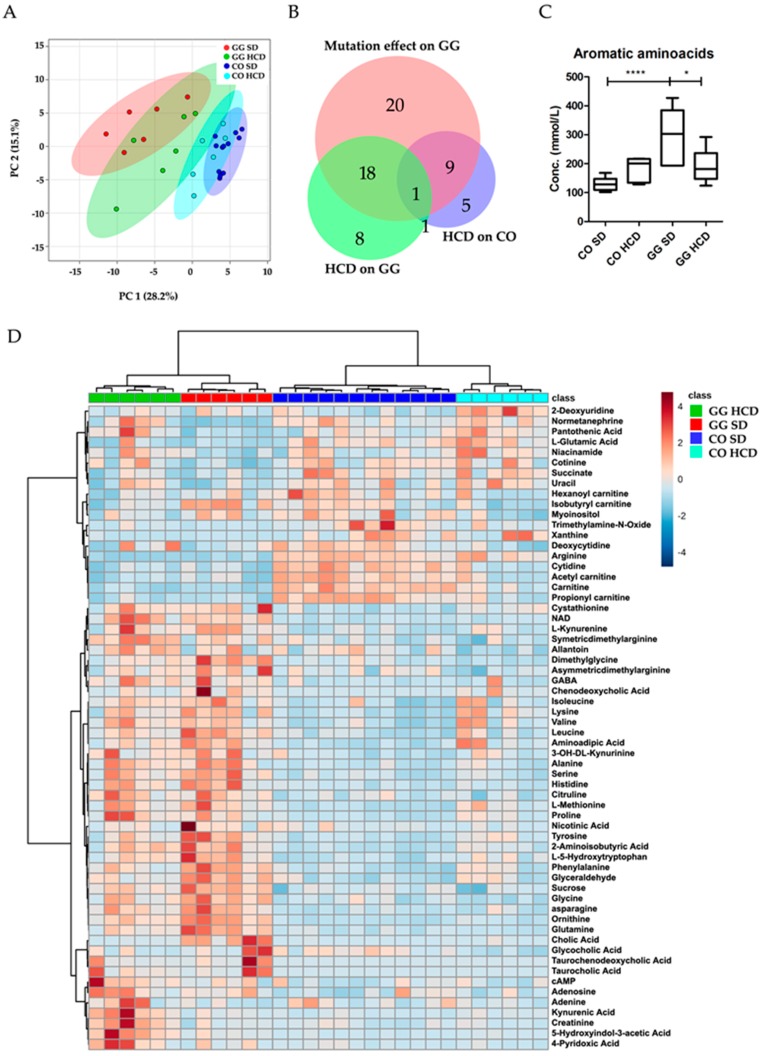
Figure 4.
Targeted plasma metabolomics analysis of Bcs1lG/G mice on standard and high carbohydrate diet. (A) A principle component analysis (PCA) plot showing separation of the feeding groups; (B) Area-proportional Venn diagram shows number of metabolites changed in mice due to the mutation and diet, overlap of circles indicates 28 metabolites that were altered by the diet in homozygotes. The diagram was generated using online BioVenn tool; (C) Aromatic amino acids (AAA) were normalized by HCD to CO level; (D) A heat map of the significantly different metabolites identified from all four mice groups (n = 6–7) i.e., control (CO) and homozygous (GG) mice fed with SD and HCD. The graphs show mean ± SD; one-way ANOVA (Tukey’s multiple comparison test); p-Values: * p < 0.05; **** p < 0.0001.

