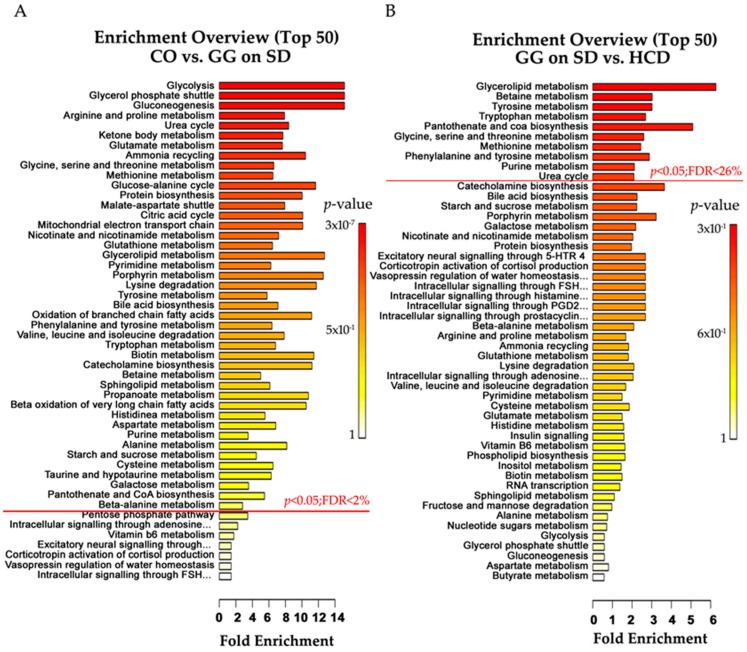
Figure 5.
Quantitative enrichment analysis. (A) List of pathways in which metabolites were changed by the Bsc1lc.232A>G mutation in homozygotes on SD; and (B) pathways altered by the HCD in homozygotes. Pathways with p-value < 0.05 are above the red line and their range of false discovery rate (FDR) is indicated.

