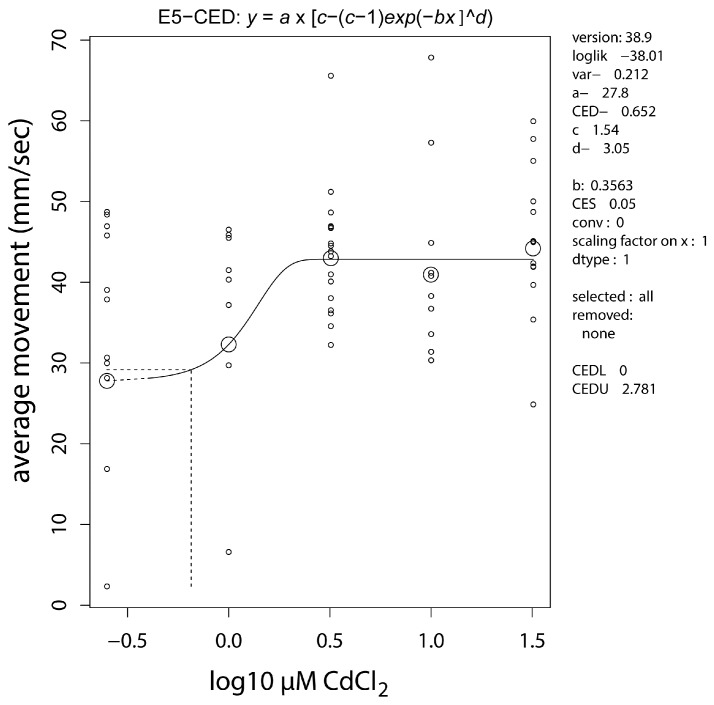
Figure 3.
Dose-response analysis of average movement of embryonically cadmium exposed, adult zebrafish. The modelled response shows an increase of 54% at the plateau (c-parameter). A 5% increase (CES = 0.05) is calculated at the critical effect dose (CED) of 0.65 µM CdCl2. Small circles, individual measurements; large circles, median values per concentration.

