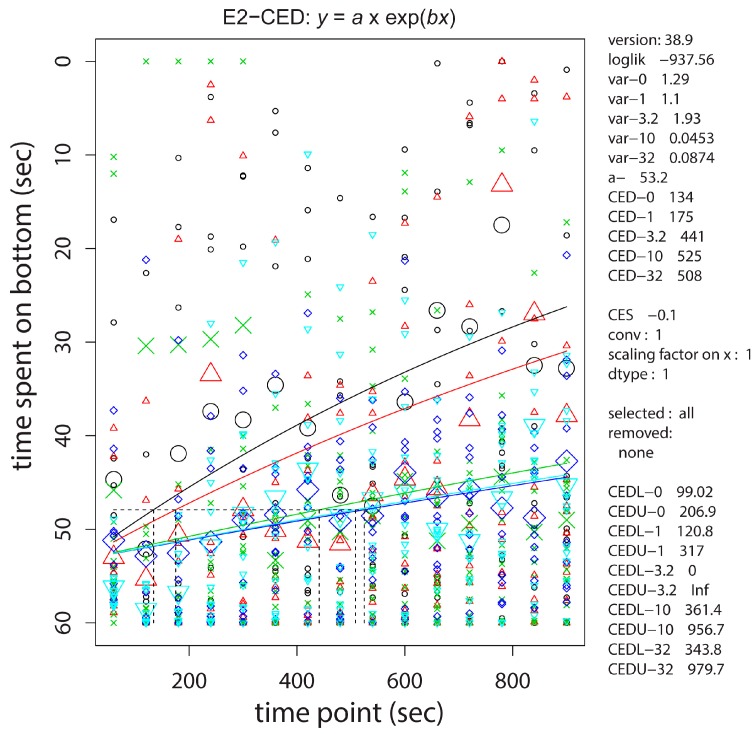
Figure 4.
Bottom dwelling response of embryonically cadmium exposed adult zebrafish after transfer to a novel environment. Each column of data points represents time spent in the bottom third of the tank in the preceding 60 s. Small and large circles are individual and median values, respectively. The embryonic exposure groups are statistically significantly separated and are shown in black, red, green, dark blue, light blue, representing 0, 1, 3.2, 10, 32 μM of embryonic CdCl2 exposure, respectively.

