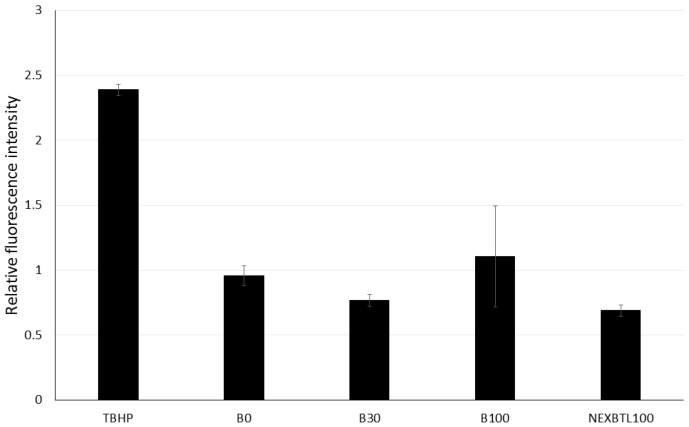
Figure 3.
Relative intracellular ROS production upon 4 h exposure to DEP extract. Results are expressed as ratios of fluorescence intensity of treated and untreated cells. Cells were incubated with 50 μg/mL of different DEP extracts and 250 μM tert-butyl hydroperoxide (TBHP) as a positive control. No significant changes between the samples treated with individual DEP extracts and the control sample were found.

