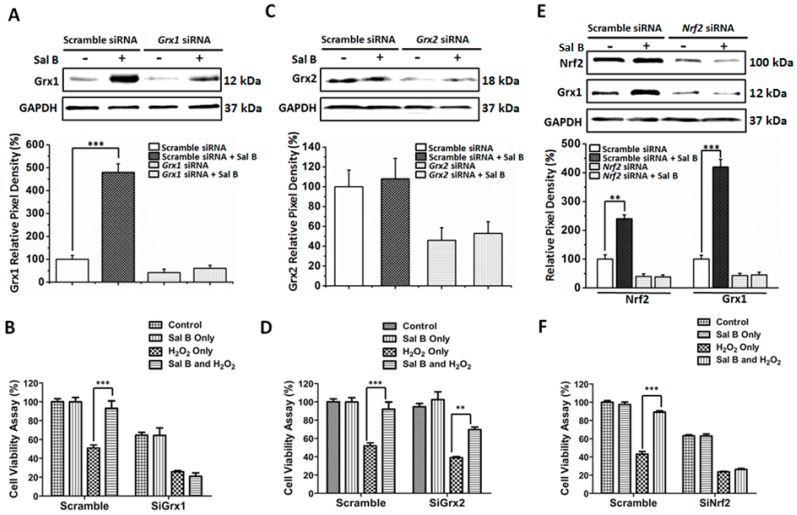
Figure 7.
Grx1 and Nrf2 knockdown abolish the cytoprotective effects of Sal B. RPE cells were transfected with scramble or Grx1 siRNA and then incubated with or without 50 μM Sal B for additional 24 h followed by H2O2 treatment for 6 h. (A) Western blot analysis of Grx1 protein levels. Total protein of each sample was subjected to Western blot with Grx1 and GAPDH antibodies. Bottom panel: the relative pixel density of Grx1 over GAPDH. *** p < 0.001 compared with the scramble siRNA control group (n = 3); (B) Grx1 knockdown abolished the cytoprotective effects of Sal B. Cell viability in each group was measured using a WST-8 assay. Values are the mean ± SEM of three experiments, n = 6; *** p < 0.001 compared with the H2O2-treated group; (C) Western blot analysis of Grx2 protein levels. RPE cells were transfected with scramble or Grx2 siRNA and then incubated with or without 50 μM Sal B for additional 24 h followed by H2O2 treatment for 6 h. Total protein of each sample was subjected to Western blot with Grx2 and GAPDH antibodies. Bottom panel: The relative pixel density of Grx2 over GAPDH. *** p < 0.001 compared with the scramble siRNA control group (n = 3); (D) Grx2 knockdown did not change the cytoprotective effects of Sal B. Cell viability in each group was measured using a WST-8 assay. Values are the mean ± SEM of three experiments, n = 6; ** p < 0.01, *** p < 0.001 compared with H2O2-treated group; (E) Nrf2 gene silencing inhibited Sal B-mediated Grx1 induction. RPE cells were transfected with scramble or Nrf2 siRNA and then incubated with or without 50 μM Sal B for additional 24 h followed by H2O2 treatment for 6 h. Total protein of each sample was subjected to western blot with Nrf2, Grx1, and GAPDH antibodies. Bottom panel: the relative pixel density of Nrf2 and Grx1 over GAPDH. ** p < 0.01, *** p < 0.001 compared with the scramble siRNA control group (n = 3); and (F) Nrf2 siRNA abolished the cytoprotective effects of Sal B. Cell viability in each group was measured using a WST-8 assay. Values are the mean ± SEM of three experiments (n = 6), *** p < 0.001 compared with H2O2-treated group.

