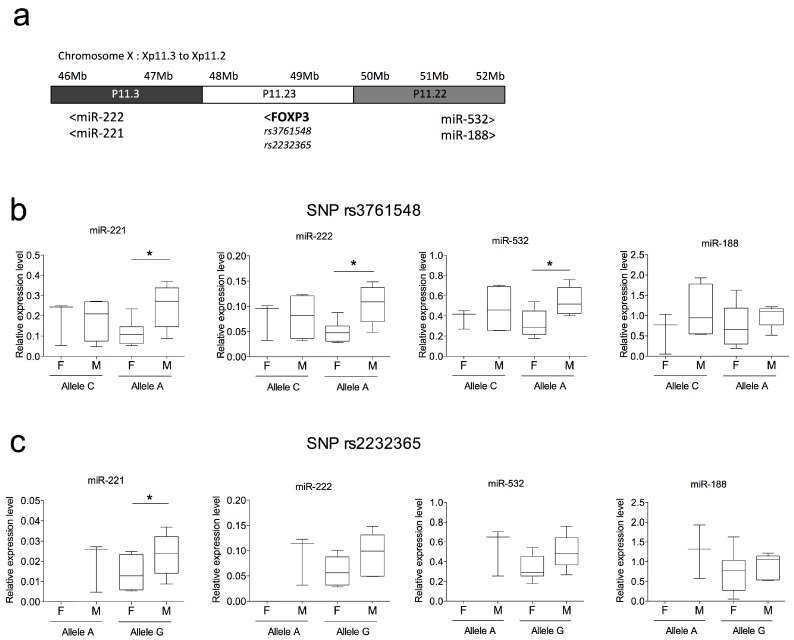
Figure 3.
Analysis of transcriptional regulatory relationships between miRNA expression levels and two FOXP3 variants associated with RA susceptibility. (a) Scheme representing the locus Xp11.3 to Xp11.2 of the human X chromosome shows the distance and position of two miRNA clusters (miR-222/miR-221 and miR-532/miR-188) located near two FOXP3 SNPs (rs3761548 and rs2232365) associated with RA; (b,c) Analysis of the transcriptional regulatory relationships between miR-221, miR-222, miR-532 and miR-188 expression levels and FOXP3 rs3761548A/C (b) and rs2232365A/G (c) variants associated with RA. Box plots represent individual sample of 11 RA female and 10 RA male PBMCs. * p < 0.05, Mann–Whitney test.

