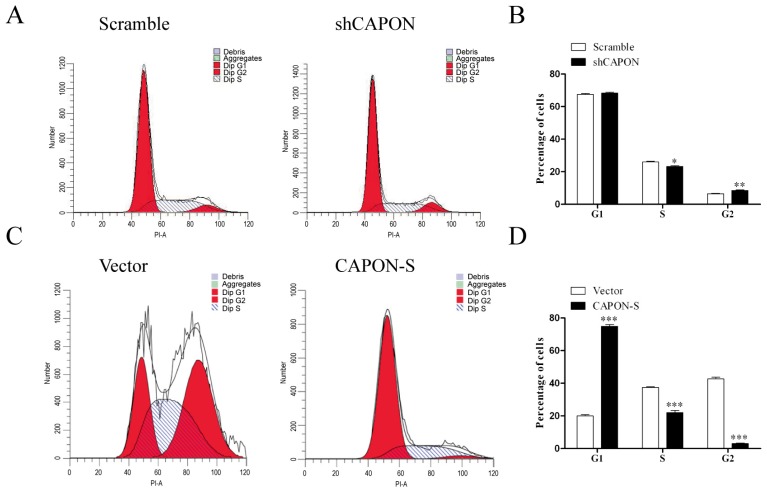
Figure 4.
Effects of CAPON-S on the cell cycle progression in glioma cells. Flow cytometry was employed to analyze the cell cycle progression in CAPON-silencing C6 cells and CAPON-S-overexpressing U87 cells. Representative histograms for C6 and U87 cells are shown in A and C, respectively. The percentages of cells at each stage of cell cycle are shown in B (C6) and D (U87) (* p < 0.05; ** p < 0.01; *** p < 0.001).

