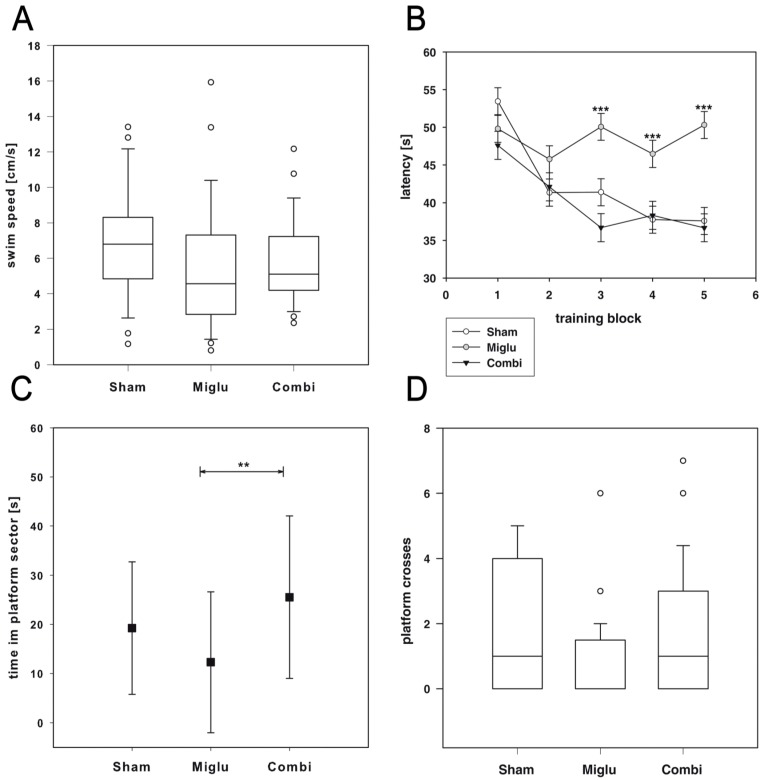
Figure 3.
Water maze test. (A) All treatment groups (nsham = 29, nmiglu = 26, ncombi = 26) showed similar swim performance (p = 0.147); (B) escape latencies for the individual trials were averaged by training block. Only the miglu-group shows no improvement of spatial cognitive capabilities. During training blocks 3–5 the miglu-group showed significant worse platform finding latencies than the sham- and combi-groups; (C) after platform removal the miglu-treated mice spent significantly less time in the respective sector than combination-treated mice; (D) differences in platform crosses did not reach significance. Asterisks indicate significant differences between treatment groups after two-way analysis of variance and Holm–Sidak post hoc analysis (** p < 0.01, *** p < 0.001). Scatter plot and line chart data are represented as mean ± SEM (B) or mean ± SD (A,C,D) Box plots depict the animal groups graphically by displaying the following descriptive statistical parameters: the median, the upper and lower quartiles, and outliers (circles) that lie outside the 10th and 90th percentiles (whiskers).

