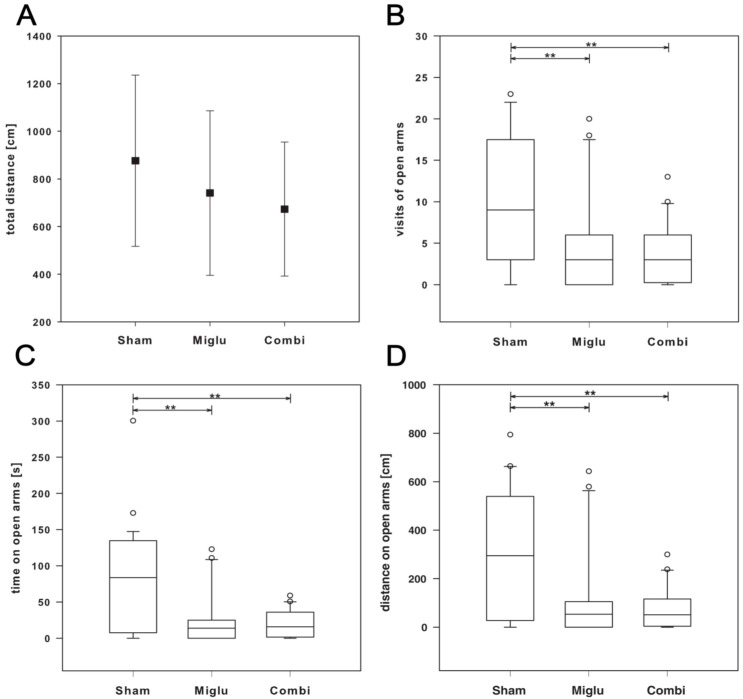
Figure 4.
Elevated plus maze test (EPM). (A) Motor activity (nsham = 29, nmiglu = 20, ncombi = 20) was not altered in treated mice as shown by total walking distance, which did not differ significantly between groups (p = 0.103); (B) number of visits of open arms; (C) distance on open arms; (D) time on open arms. Asterisks indicate significant differences compared to the sham group (** p < 0.01). Data of scatter plot are represented as mean ± SD. Box plots depict the groups graphically by displaying the following descriptive statistical parameters: the median, the upper and lower quartiles, and outliers (circles) that lie outside the 10th and 90th percentiles (whiskers).

