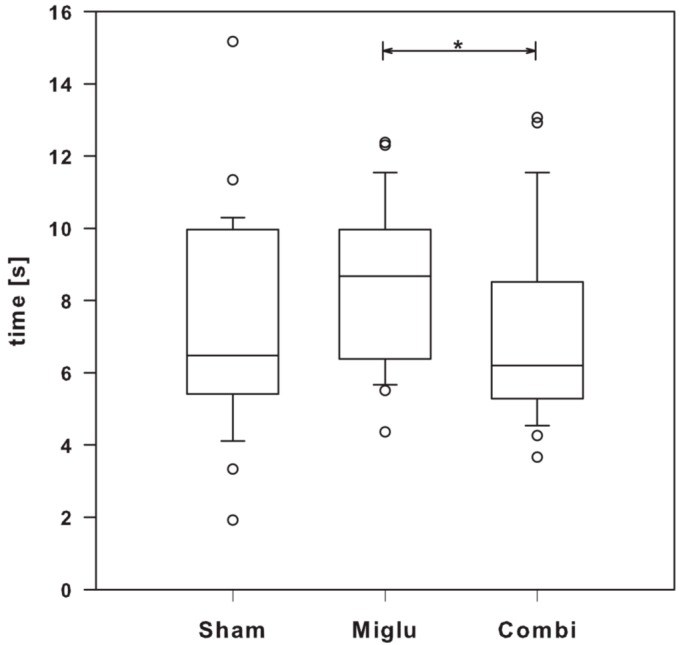
Figure 6.
Hot-plate test. Significant differences in pain sensitivity were seen between miglu- and combi-groups (nsham = 29, nmiglu = 26, ncombi = 26). However, none of the treatment groups was significant different from the sham-group. Asterisks indicate significant differences between treatment groups after one way analysis of variance on ranks and Dunn’s all pairwise multiple comparison procedures (* p < 0.05 ). Box plot depicts the animal groups graphically by displaying the following descriptive statistical parameters: the median, the upper and lower quartiles, and outliers (circles) that lie outside the 10th and 90th percentiles (whiskers).

