Figure 8.
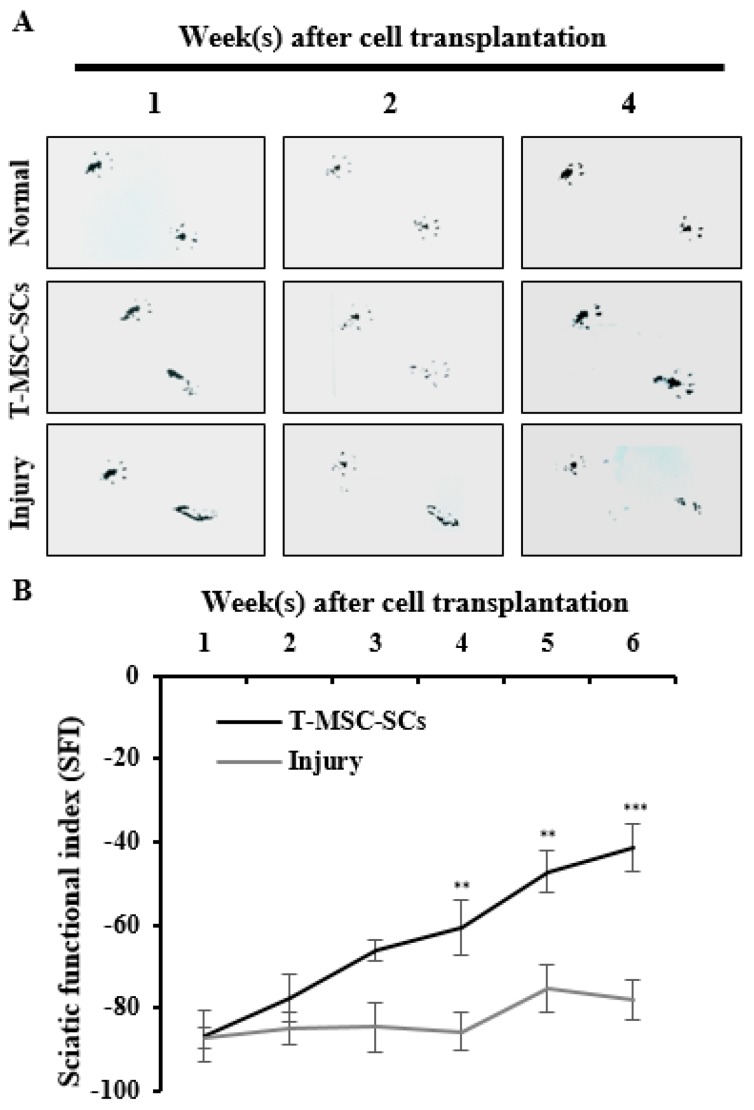
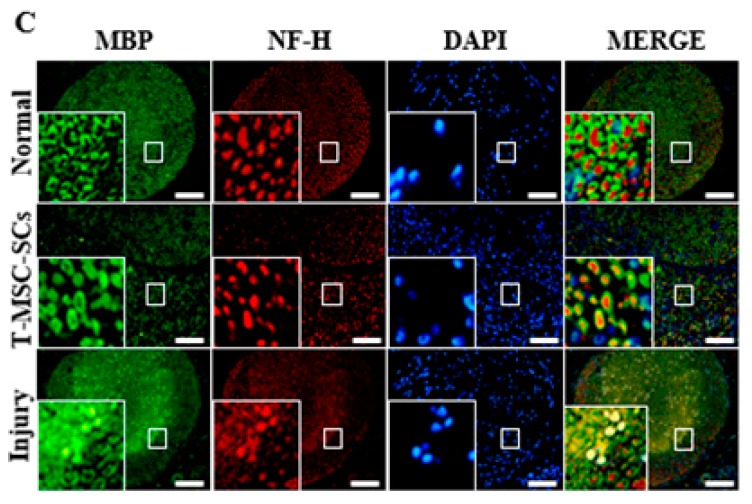
Mouse footprints and immunohistochemistry of the mouse sciatic nerve: (A) Mouse footprints at one two and four weeks after cell transplantation. The lower footprints represent the injured side in the T-MSC-SC transplantation group (T-MSC-SCs), injured control group (injury), and non-injured control (normal). Toes were clearly separate from Week 2 in the transplantation group. No significant change was observed in the injury group; (B) The SFI from footprinting analysis six weeks after surgery (n = 6 for each group). Statistical analyses included two-way ANOVA with Bonferroni post hoc tests (** p < 0.01; *** p < 0.001); (C) Immunohistochemistry of the mouse sciatic nerve six weeks after surgery. Immunofluorescent double staining of sciatic nerve tissue was performed with antibodies to MBP (green, a myelin marker), NF-H (red, an axonal marker) and DAPI (blue). The transplantation group showed regenerating axons surrounded by SCs. Original magnification 400×. Scale bar = 200 µm.


