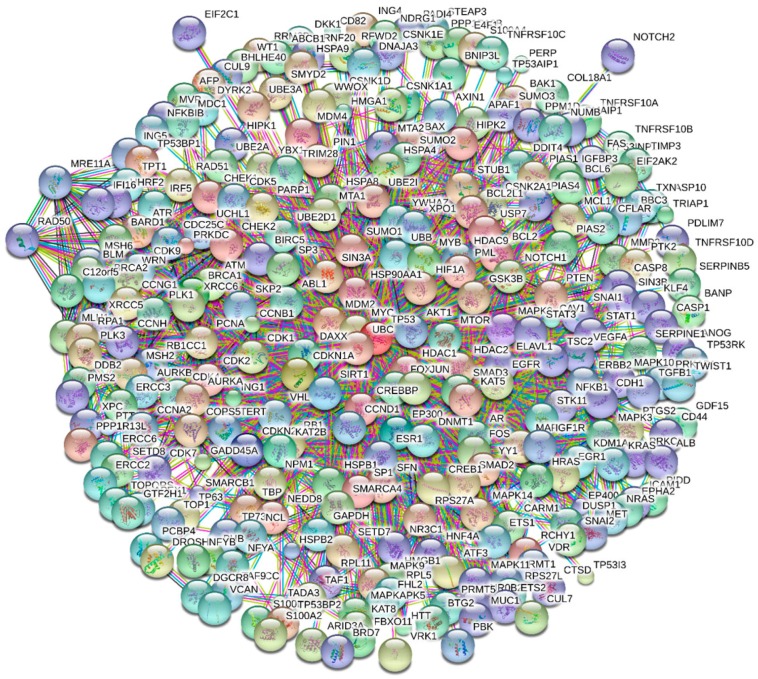
Figure 3.
Analysis of the interactivity of human p53 (UniProt ID: by STRING computational platform that produces the network of predicted associations centered at the query protein [100]). Seven types of evidence are used to build the corresponding network, where they are indicated by differently colored lines: a green line represents neighborhood evidence; a red line—the presence of fusion evidence; a purple line—experimental evidence; a blue line—co-occurrence evidence; a light blue line—database evidence; a yellow line—text mining evidence; and a black line—co-expression evidence [100]. In this analysis, the most stringent criteria were used for the selection of interacting proteins by choosing the highest cutoff of 0.95 as the minimal required confidence level.

